Typ pytania - Równanie
From LimeSurvey Manual
Krótki opis
Ten typ pytania pozwala autorowi utworzyć równanie (np. obliczenie lub dostosowany raport) i zapisać je w zmiennej bazy danych. Równania mogą używać dowolnej składni obsługiwanej przez ExpressionScript. Jeśli masz do czynienia z wartościami numerycznymi, upewnij się, że korzystasz z zaawansowanego ustawienia pytania „Tylko liczby”, jak wyjaśniono poniżej.
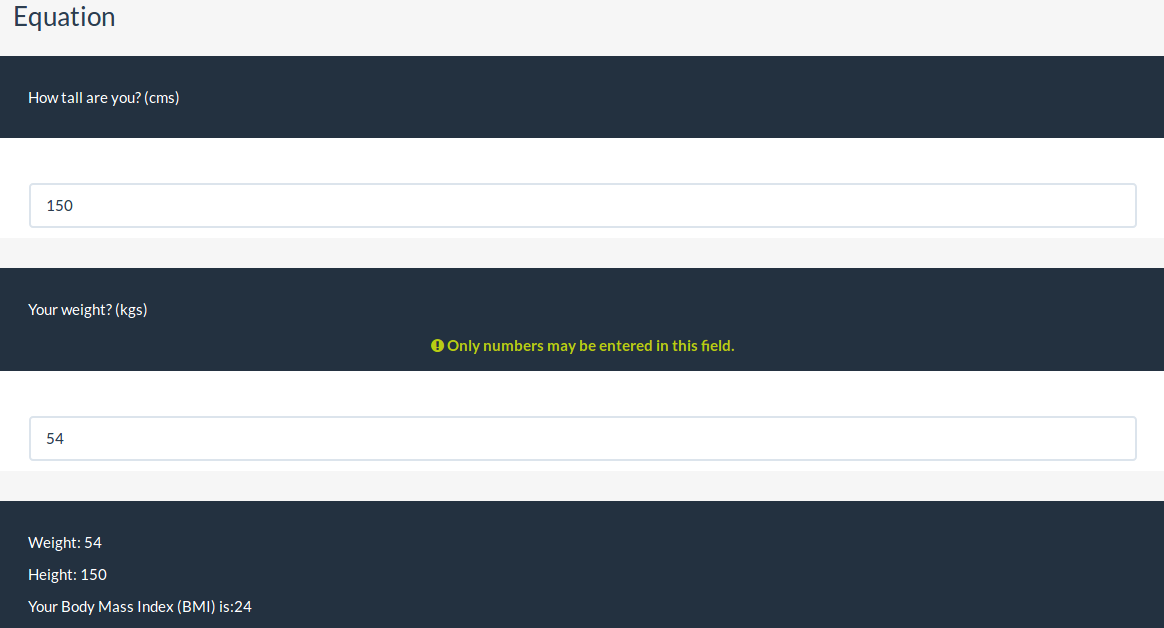
Poniżej znajdziesz przykład użycia tego typu pytania:


Przykład: Limesurvey_survey_BMIsample.lss.zip.
Edycja równania
Używanie dedykowanego ustawienia
Najlepszym sposobem edycji równania jest użycie dedykowanych ustawień: pozwala to na użycie tego samego równania dla różnych języków i daje pewność, że w równaniu nie jest zintegrowany żaden kod HTML. Dzięki temu możesz pokazać użytkownikowi całe zdanie, ale zapisać w bazie danych tylko potrzebną wartość: na przykład wpisz {wagakg/wysokość} w ustawieniach równania i pokaż „Twoje BMI to {self.NAOK}”.
Jeśli potrzebujesz wyrażenia w środku: musisz dodać nawias klamrowy.
Używanie tekstu pytania
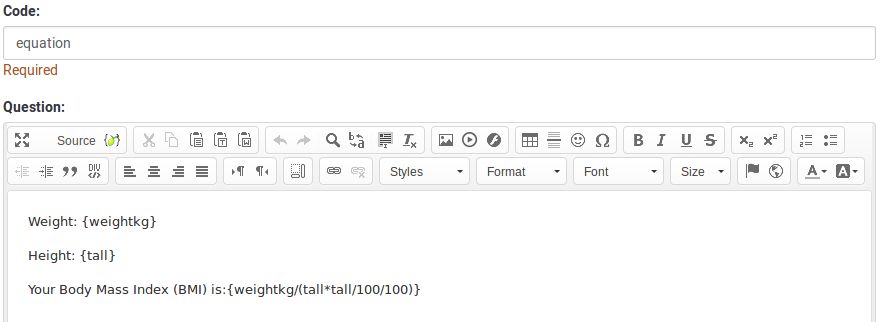
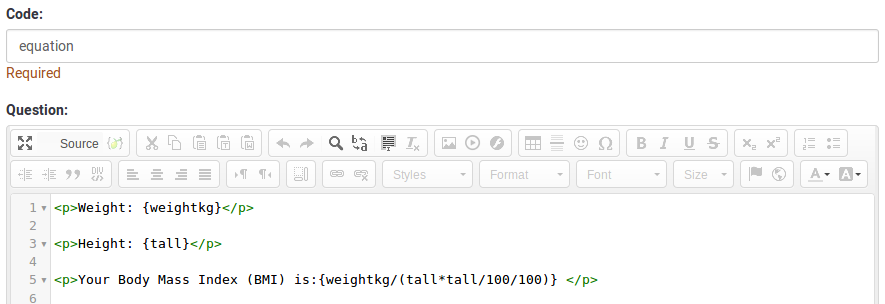
Możesz edytować za pomocą edytora HTML/WYSIWYG lub ze źródła HTML:
- Korzystanie z edytora WYSIWYG:

- Ze źródła HTML:

Jeśli chcesz zapisać w tabeli odpowiedzi czysty tekst lub czystą wartość liczbową, zalecane są zmiany w kodzie źródłowym. Edytując źródło, możesz usunąć/usunąć dowolny kod HTML, który może mieć wpływ na proces przechowywania.

Opcje ogólne
Wyświetlacz
CSS class (css_class)
Description
If you want to add special CSS classes to certain questions, you can enter the CSS class name(s) in this box. Make sure you leave an empty space between different class names.
Valid values
- Any text string with a space between different CSS class names.
Relevance help for printable survey (printable_survey_relevance_help)
Description
If you wish to print a survey, you can also print the relevance equations for each question. But, if you wish to offer instead an explanation rather than the expression on the printed form, fill in this box with the text explanation for the relevance equation.
Valid values
- Any text and/or numbers you wish to be displayed on the printable form.
Logika
Inne
SPSS export scale type (scale_export)
Description
This is used for SPSS export only. This attribute overrides the default scale guessed by SPSS. To learn what the different measurement scales do, please read the related SPSS documentation.
Available options
- Default (default)
- Nominal
- Ordinal
- Scale
Numbers only (numbers_only)
Description
If you enable this option, the participant can only enter numbers in the text box(es).
For the equation question types, this setting indicates that the result could only be a number, not a string. This will guarantee proper calculations/conversions in follow-up equations regarding the decimal mark.
Behavior by question type
- Default: If the subject enters a value that is not a number, that value is immediately cleared from the text box so that the subject can enter an appropriate value.
- Array (Texts): If the numbers only option is disabled, the "Show totals for" and "Show grand total" options will be overruled, while the total text boxes will not be displayed.
- Equation: Enabling this option will force the equation results to be converted to a numeric value. If the equation result is not a number (and not blank), the equation will return NaN, being saved as an empty string in the response table.
Available options
- On
- Off (default)
Statystyki
Show in public statistics (public_statistics)
Description
This attribute allows the survey administrator to chose if a particular question results should be displayed to the survey participants after they submitted the survey.
The default setting for each question is 'Off' (=Do not show the question statistics to the respondents). You have to enable this for every single question if you want to show the survey statistics of that (those) particular question(s) to the survey participants after the survey submission.
Available options
- On
- Off (default)
Display chart (display_chart)
Description
This attribute allows the survey administrator to choose if a chart that contains the question results should be displayed to the survey participants after they filled out the survey.
- public statistics survey setting from the presentation & navigation settings
- show graphs survey setting from the presentation & navigation settings
- public statistics question attribute, and
- display chart question attribute.
Available options
- On
- Off (default)