Table content
What is Statistical Significance?
Statistical significance indicates whether the results of a survey or experiment are likely to be genuine and factual rather than occurring by chance. It helps researchers and businesses determine the reliability of their data.
For example, if a marketing team finds that 55% of customers prefer lime sorbet over pineapple with a significance level of 95%, it suggests that the results are trustworthy and did not occur by chance.
Why is Statistical Significance Important?
Understanding statistical significance is crucial for making informed decisions. It helps businesses validate marketing strategies, build confidence and reliability in research, make data-driven decisions for businesses, and reduce uncertainty in survey results.
How is Statistical Significance Calculated?
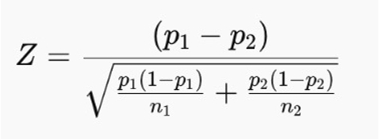
To determine the statistical significance of your data, use the following formula:

Now, let’s break down these variables:
- p1 and p2 are the proportions of success in two different groups
- n1 and n2 are the sample sizes of each group
- Z measures how many standard deviations the observed difference is from the mean
- The value of p is derived from Z and ultimately determines the significance of the results
The p-value is then compared against a significance level (typically 0.05 for a 95% confidence level). If the p-value is lower than the significance level, the difference is considered statistically significant.
Try our statistical significance calculator now!
The Role of Confidence Levels in Statistical Significance
When calculating statistical significance, confidence levels play a major role: they indicate the probability that the observed effect is real. Common confidence levels include:
| Confidence Level | Z-Score |
|---|---|
| 90% | 1.64 |
| 95% | 1.96 |
| 99% | 2.58 |
Higher confidence levels provide stronger certainty, but require larger sample sizes. For example, a study conducted with a 90% confidence level may require 500 participants—but the researcher will need to poll 1,000 participants to increase the confidence level to 99%.
An Example of Statistical Significance Calculation
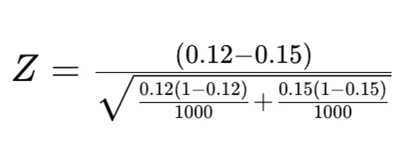
Imagine your sorbet company is testing two different landing page designs to determine which one is more effective at getting people to sign up for your newsletter.
- Page A has a conversion rate of 12%, meaning that out of 1,000 visitors, 120 people signed up for the newsletter.
- Page B has a conversion rate of 15%, meaning that out of 1,000 visitors, 150 people completed the same action.
At first glance, Page B seems to be performing better—but is this difference due to chance, or is it statistically significant?
To answer this, the company needs to calculate the statistical significance.

Once the team knows the p-value, they can then compare it against their desired confidence level. If they want a 95% confidence level, the p-value needs to be less than 0.05 to make it statistically significant. This means the improvement in conversions is likely real rather than random variation.
However, if the p-value is greater than 0.05, the observed difference might be due to chance, and further testing with a larger sample may be needed to confirm the result.
With statistical significance testing, the company can confidently choose the better-performing page to optimize newsletter sign-ups.
How Statistical Significance Impacts Survey Results
Survey results that achieve statistical significance indicate meaningful differences between respondents, helping researchers and businesses confirm the validity of their data while instilling greater confidence. This is useful for:
- A/B testing in marketing
- Customer satisfaction surveys
- Election polling
- Product preference studies
How to Improve Statistical Significance
A higher statistical significance score reduces the likelihood that results are due to chance, making research more credible and impactful. In the event that a statistical significance score needs to be improved, whether to increase the reliability of findings or ensure data-driven decisions are based on meaningful results, there are a variety of ways to design the next test.
Statistical significance scores can be improved by:
- Increasing the sample size
- Reducing variability in data collection
- Using a higher confidence level for stronger reliability
- Crafting clear and unbiased questions during the survey creation process
Statistical significance is a key factor in determining whether survey results are reliable. With the right methodology and sample size, businesses and researchers can confidently make data-driven decisions.
Try our free Statistical Significance Calculator today to validate your findings!
Create your first survey now!
It’s as easy as squeezing a lime.
- Create surveys in 40+ languages
- Unlimited number of user
- Ready-to-go survey templates
- So much more...

