What exactly is a Likert Scale?
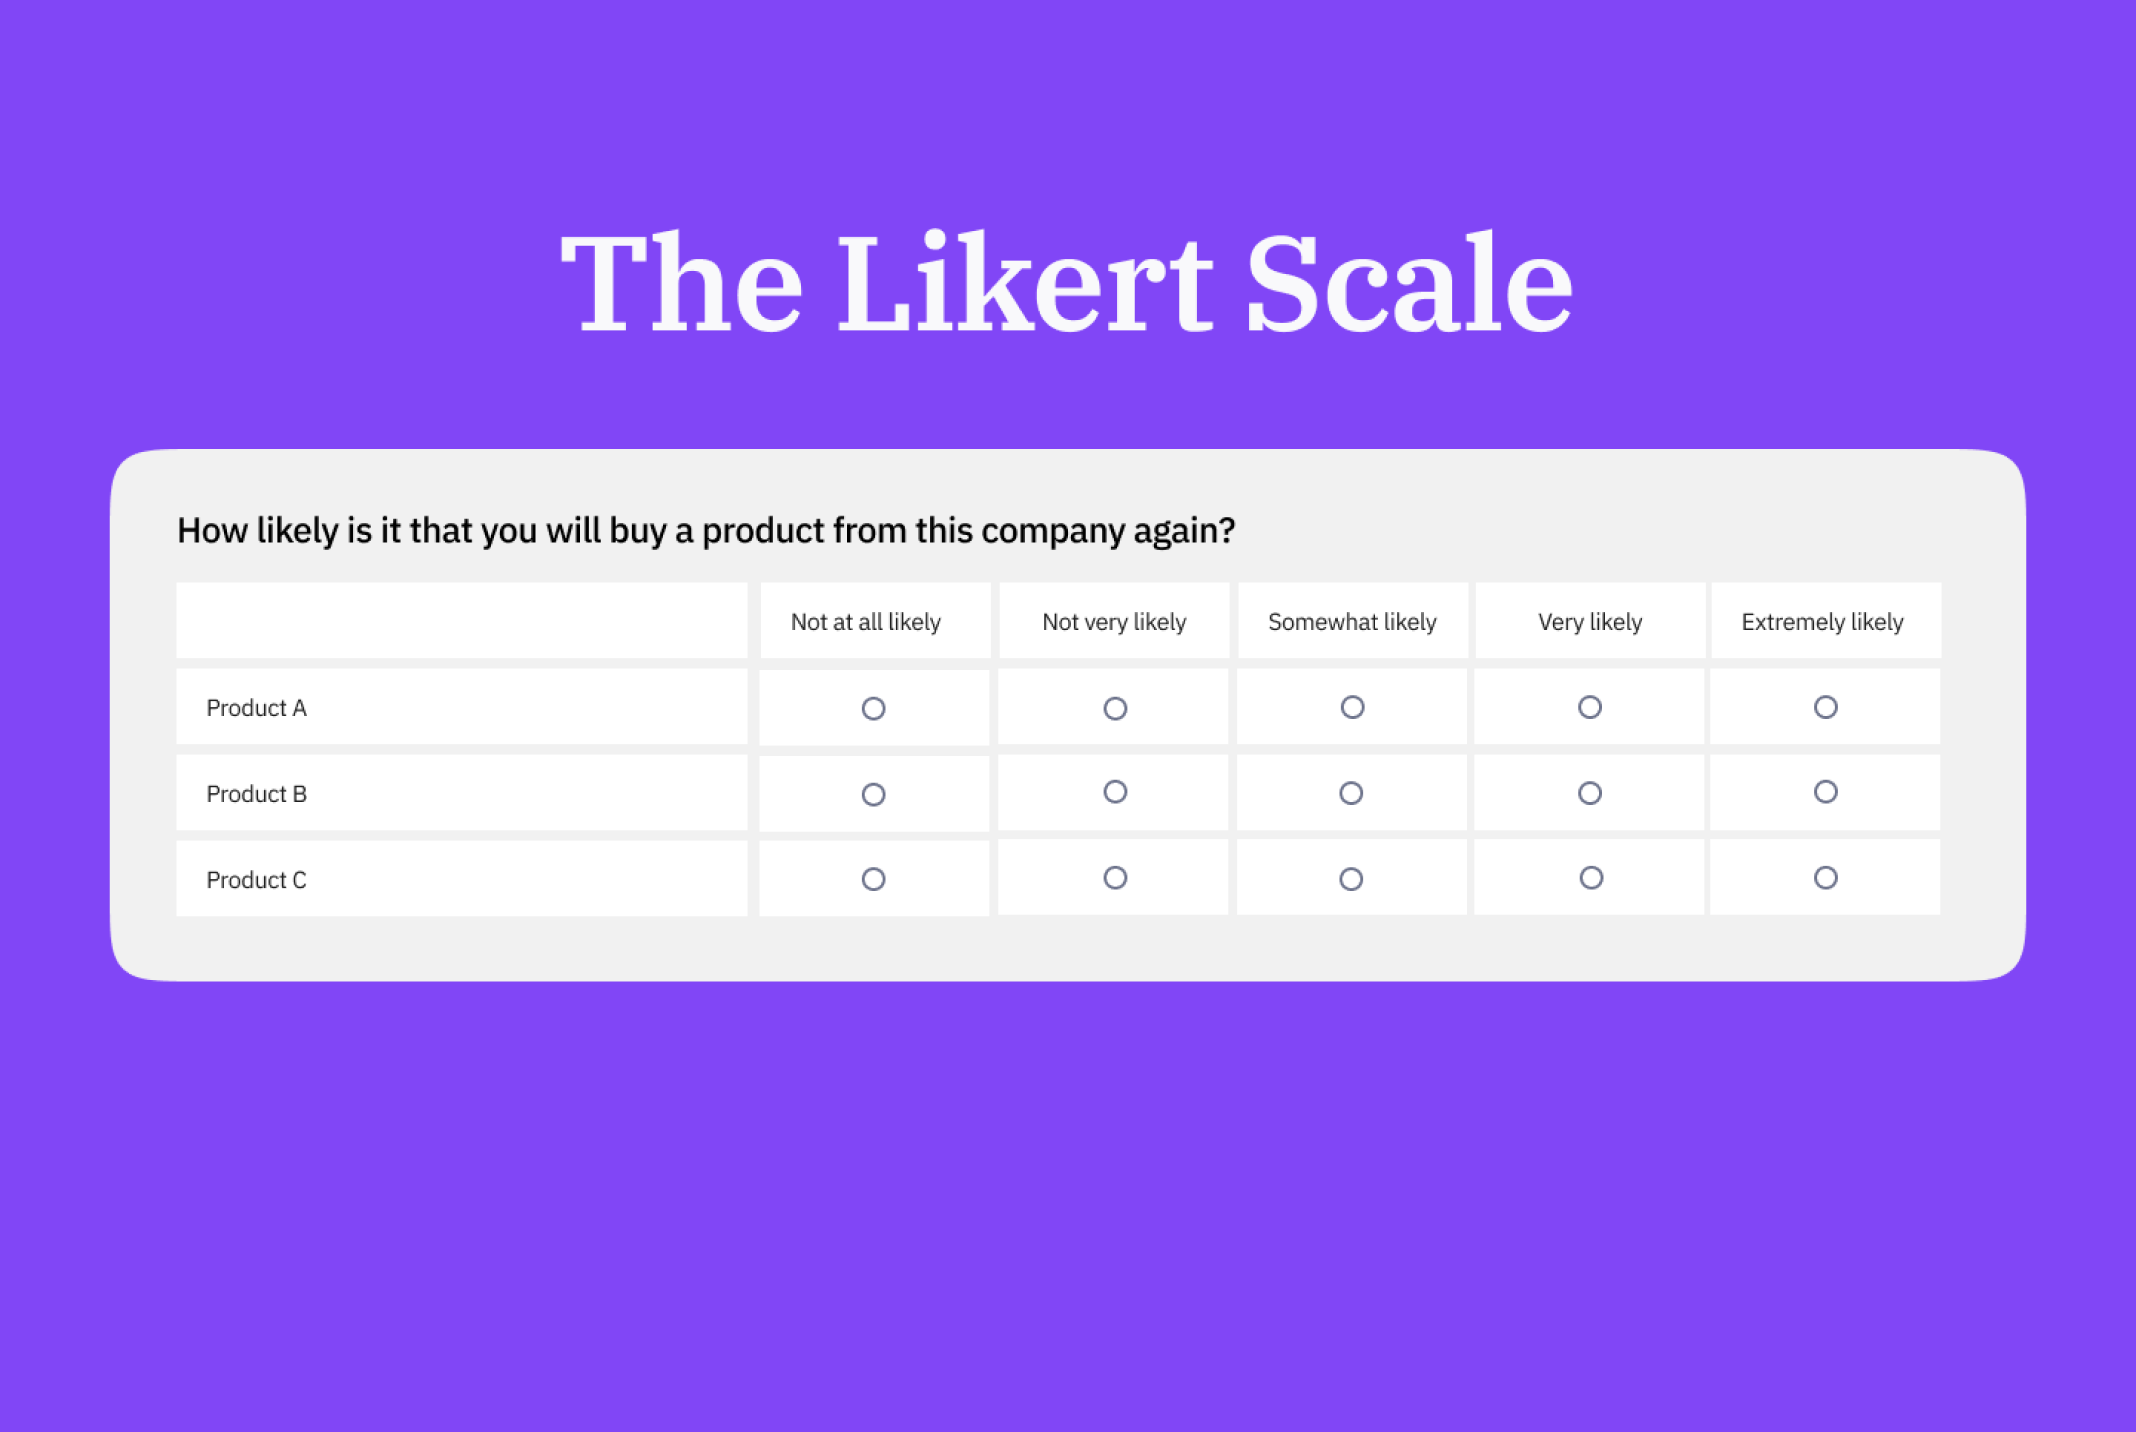
The Likert scale or Likert-type scale, named after its inventor, the American social scientist Rensis Likert, is a usually ordinal type of psychometric rating scale that is used to capture attitudes within an agreement-disagreement range. Hence, a Likert scale is the sum of responses on several Likert options.
When conducting a survey, the response on a Likert scale represents either the intensity of agreement to disagreement ("Extremely agree" vs. "Extremely disagree") with the question statement, making it a bipolar rating method, or the intensity of just an agreement or just a disagreement ("Extremely agree" vs. "Not at all agree" or "Extremely disagree" vs. "Not at all disagree") with the question statement, making it a unipolar rating method.
It can be designed as an uneven-point scale, e.g., a 5-point or 7-point scale, with a neutral middle option, or an even-point scale, e.g., a 4-point or 6-point scale, omitting a neutral option and forcing a more positive or negative response choice.
Either of these two options requires full symmetry, i.e., ensuring bilateral symmetric distances from an existing or an imaginary neutral option and equal numbers of positive and negative options.

How to Present Likert Scales in Online Surveys
Ultimately, a Likert scale question may be arranged vertically or horizontally.
However, there have been researchers investigating the possibility of something called a left-side bias when displaying a Likert scale question horizontally. Essentially, left-side bias means that when placing answer options on the left side of the Likert scale, there is a tendency among respondents to select these options, said tendency being somewhat stronger for positive options on the left side than negative options.
Furthermore, there has been equivalent research showing a similar, yet even stronger selection bias for vertical Likert scales as respondents tend to skip lower displayed answer options and more often select the top options.
Based on these statements, certain scale layouts appear more suitable to avoid survey bias and sloppy question answering than others.

Horizontal Likert Scale:
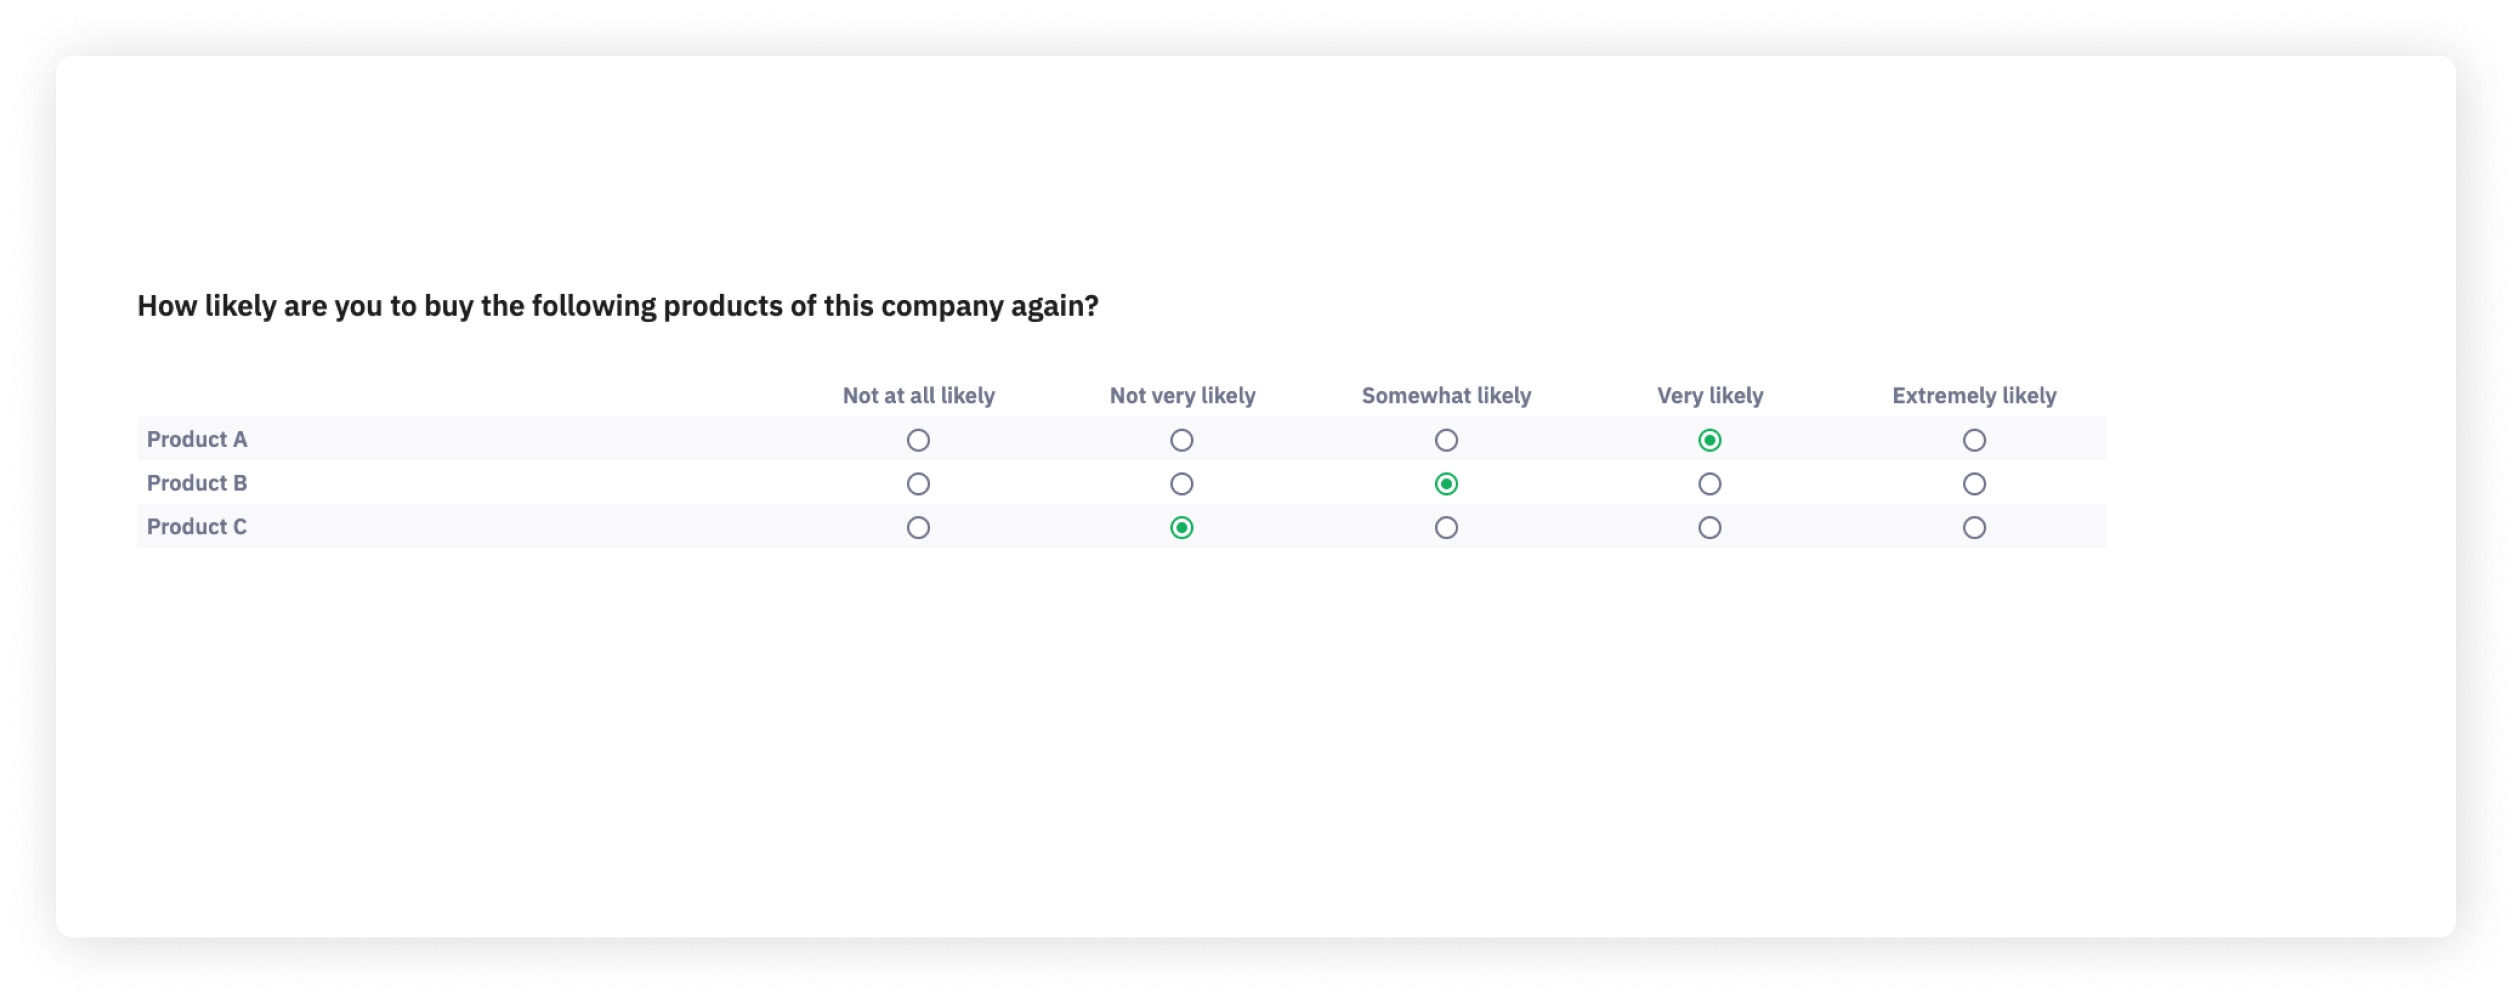
According to the Likert scale bias matrix, to keep the bias as low as possible in a horizontal order, it appears best to place negative attitude options on the left side of the scale and positive attitude options on the right side of the scale. This example is using a 5-point scale.

Vertical Likert Scale:
According to the Likert scale bias matrix, to keep the bias as low as possible in vertical order, it appears best to place negative attitude options at the top of the scale and positive attitude options at the bottom of the scale.
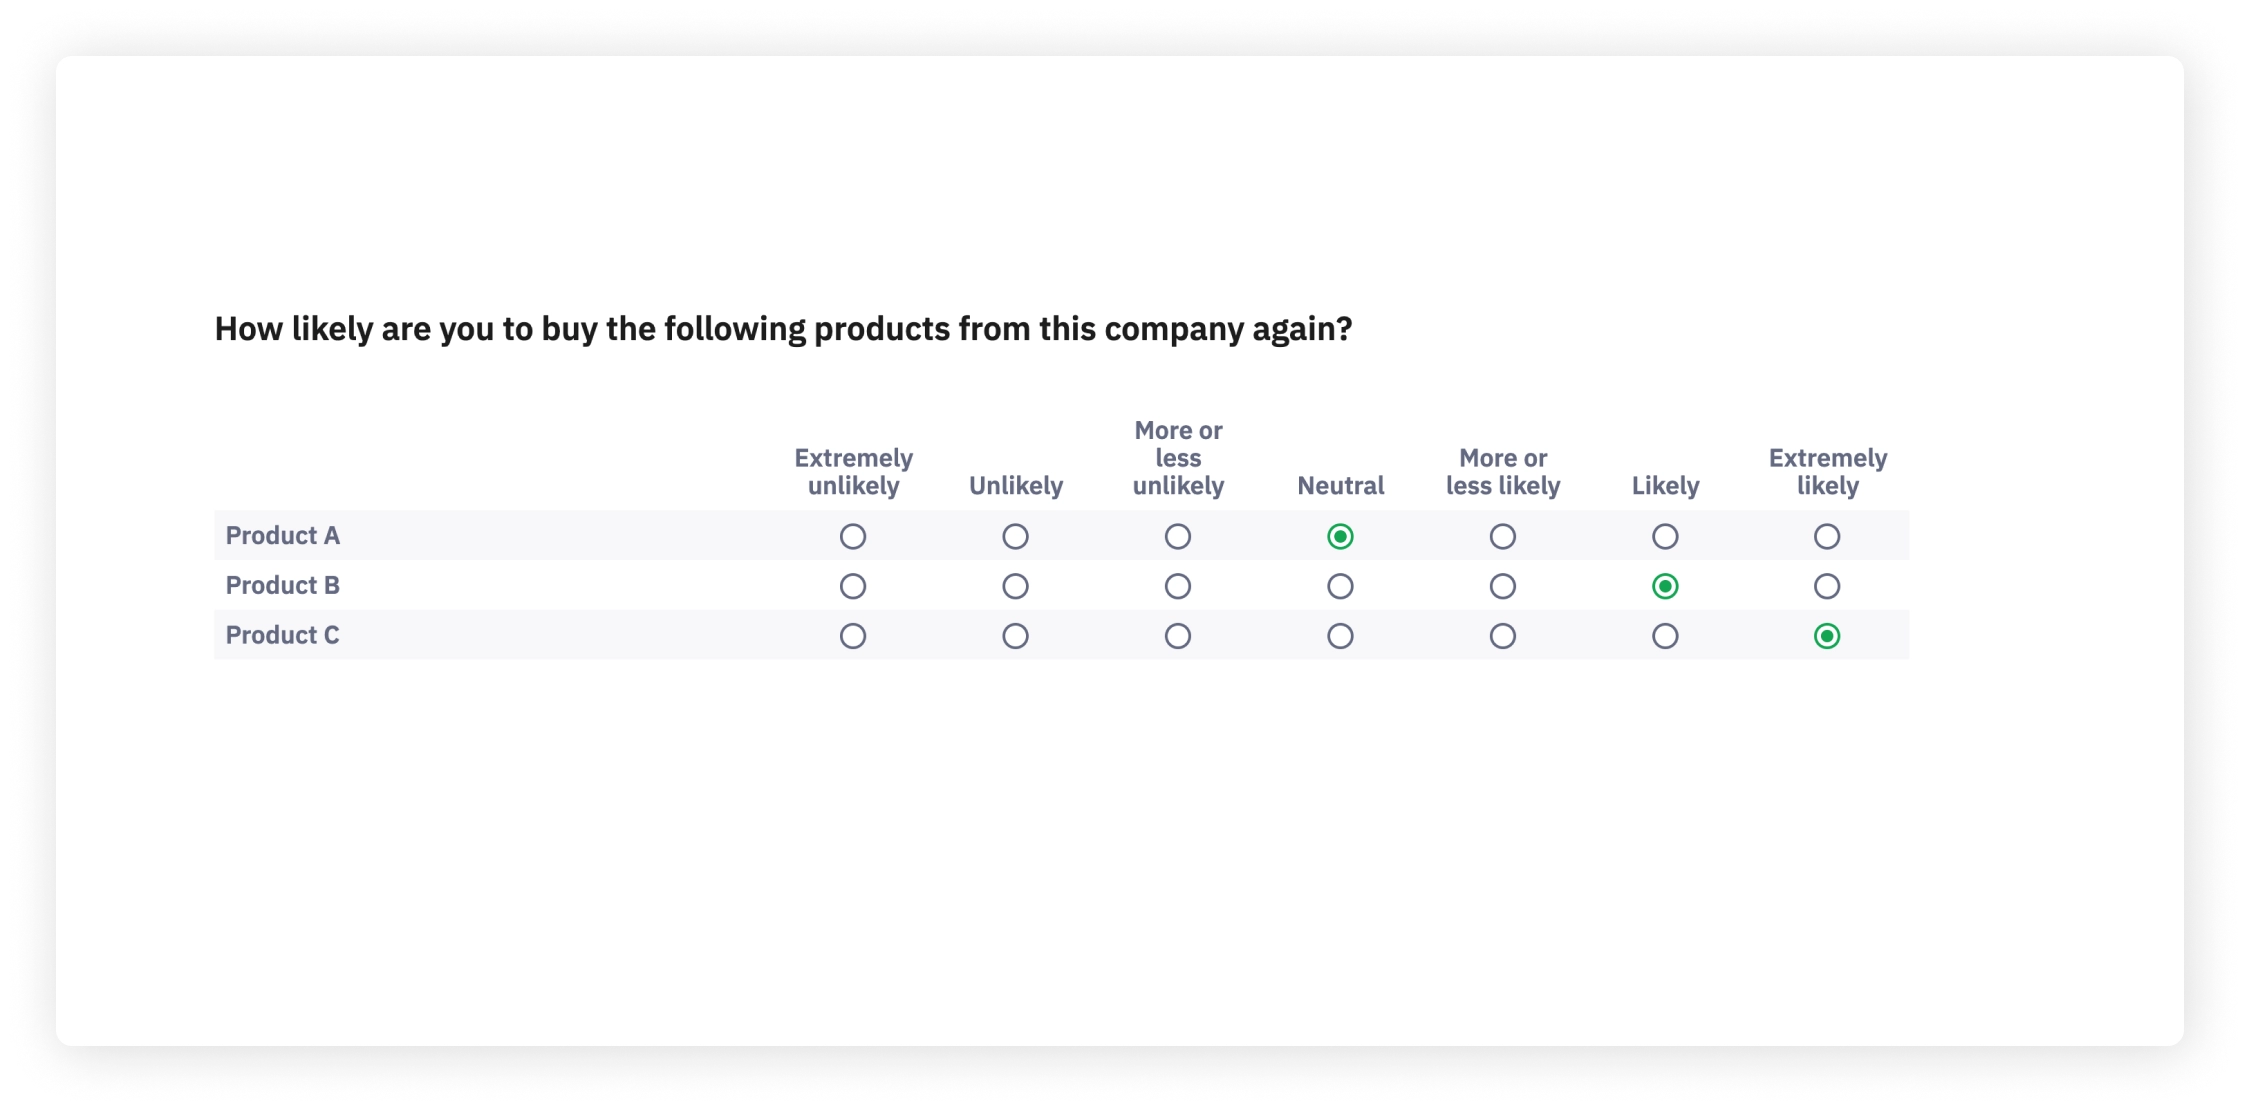
In addition, Likert scales can be modified to hold 7 or more answer options depending on the level of refinement that is required for a specific question or survey.
Horizontal 7-point Likert Scale:

Vertical 7-point Likert Scale:

Creating Likert Scales in LimeSurvey
There are several possibilities in LimeSurvey to create Likert scale questions either in horizontal or vertical order.
To create horizontal Likert scales with text items, you may, for instance, use the Array or Array dual scale question types.
To create vertical Likert scales with text items, you may, for instance, use the List (radio) or the List (dropdown) question types.
When to use Likert Scales?
The Likert Scale is particularly valuable when you are trying to understand complex sentiments about your product, service, or initiative. Whether you're gauging employee satisfaction, customer experiences, or public opinions.
Let's say you're conducting a customer satisfaction survey. A simple yes/no question might tell you whether the customers are satisfied, but a Likert scale will reveal the extent of their satisfaction. This degree of satisfaction can be the decisive factor for product improvements, service modifications, or marketing tactics.
Moreover, Likert Scales are easy for respondents to understand and complete, contributing to better response rates and less survey fatigue. Plus, they are statistically sound, giving your data analysis process robust and reliable inputs.


