Widgets design document
From LimeSurvey Manual
This is a list of widgets, with design mock-ups (not final!) and brief description of information displayed. Each section represents a widget, each bolded statement represents a tab inside the widget. Other options are described in italics.
Note that some tabs might need better grouping. Some tabs may need to be considered as separate widgets and v.v.
About Graphs
Complicated graphs, such as bar charts, pie charts, line plots displaying lots of data and information will be generated using a PHP Charting library (denoted by [lib]). For simpler graphs (such as the Completion tab of Survey Summary widgets), it is advisable to use plain HTML + CSS (denoted by [HTML]).
Survey Summary
Displays brief summary information about a survey.
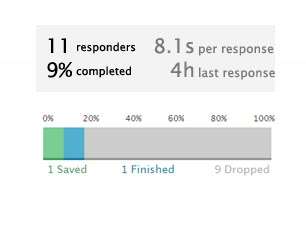
- Completion:
- Total number of responses, percentage completed, breakdown + graph [HTML]
- (?) Additionally, time per response and time since last response
- Mockup:
- Responders
- A graph of responders per day, in the last timeframe
- timeframe can be: last day, last week, last month

Responders
- Graph (needs a better name):
- A graph of responders per day, perhaps more detailed and with more options
- e.g. selectable timeframe + filtering: show only completed..
- Country:
- Country from which the response came from, displayed as a table || Country (+Flag) | Responses | % ||
- Can be switched to a bar/pie chart [lib]
Individual Responses
- Table:
- Table: || Response ID | Status (complete|saved|incomplete) | Date | Time taken ||
- Clicking on a row reveals an 'action' bar, where user can select to view details of the response
- This can either be a lightbox-type popup displaying further information (more space, but obtrusive lightbox)
- or a subgrid, displayed inside the widget (less space, may cause more clutter)
 (Example subgrid)
 (Example Lightbox popup)
Technical
Displays technical data from responders.
- Browser:
- Browser used, display as table/bar/pie chart
- Plugins:
- Whether certain browser technologies were available: flash, cookies, javascript. Again, table/bar/pie chart as proportion of have/not have
- Screen:
- Screen resolution, maybe format as well. Table/bar/pie
- OS:
- OS used, Table/bar/pie, with breakdowns for different versions of certain OSes. Display as subgrid or some form of clever graph.
Local Time
Number of responses at a given time during the day. Might be useful to know at what time did the visitors take the survey.
Question Breakdown
Displays a table/list of all questions, with a breakdown of the answers given. Something like this:

Each question type needs to implement a way to display such a breakdown and certain question types (esp. those involving long text answers) can be tricky. Note how this has been solved in the above case (questions 3.Pluses and 4.Minuses). Screenshot from Webform drupal module)
Tag clouds
Basically, displays a selection of the above information as a tag cloud. Might be implemented as just another way of displaying data, along with bar/pie/table options.