Expression Manager sample surveys
From LimeSurvey Manual
Introduction
The best way to learn how to use the ExpressionScript is to play with working examples and modify them to your needs.
You may find below a set of sample surveys to demonstrate (and test) how the EM can be used to enhance your survey. These surveys can be found in the distribution's /docs/demosurveys folder.
Relevance, Tailoring and Equations
Overview
The following example computes the BMI (Body Mass Index) of each respondent. See below the features that are demonstrated within this example.
EM Features Demonstrated
- Relevance - support for powerful conditional logic;
- Piping / Tailoring - offers the ability to pipe or tailor answers and question metadata;
- Dynamic Tailoring - note that reports are changed on the page as you answer questions.
- Micro-Tailoring - conditional tailoring withing sentences and reports using if() statements
- Equations - a new question type that lets you do calculations and store the results in the database, even if the calculation is hidden
- Conditional Validation - validation criteria, such as the minimum allowable value, can be conditional - e.g., based upon equations.
Screenshots
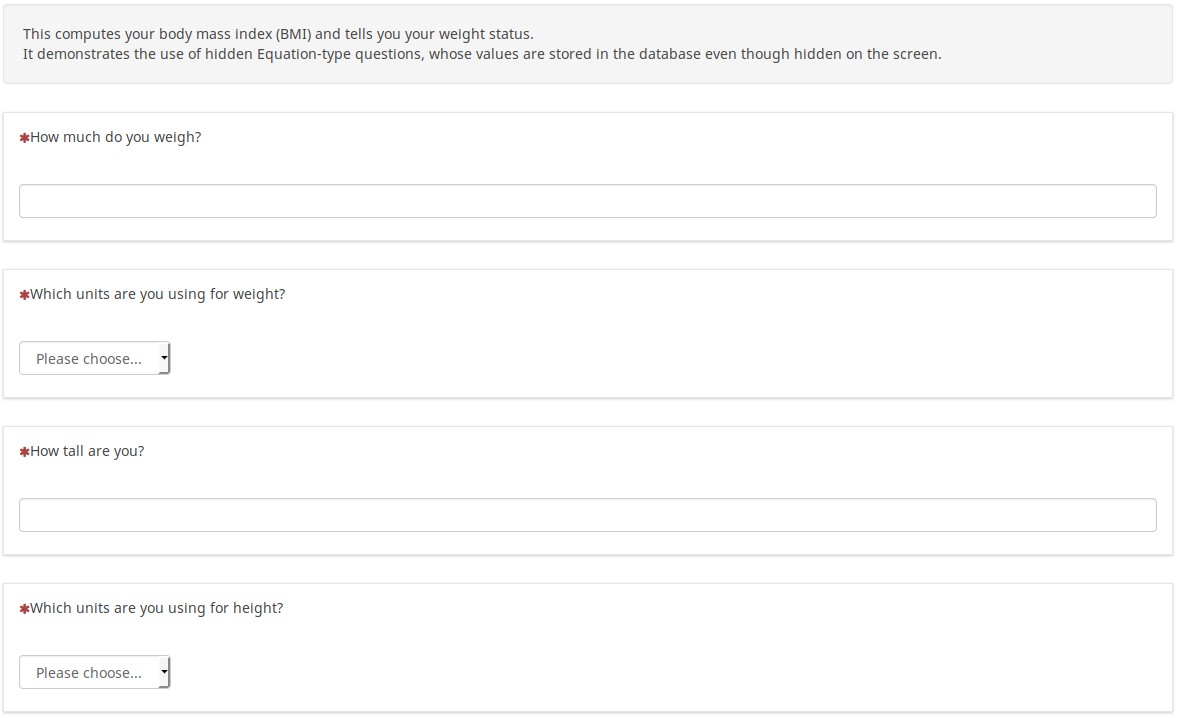
This example computes the Body Mass Index, a calculation of your weight and height to determine whether you are overweight. Note that initially, all you see are the four mandatory questions:
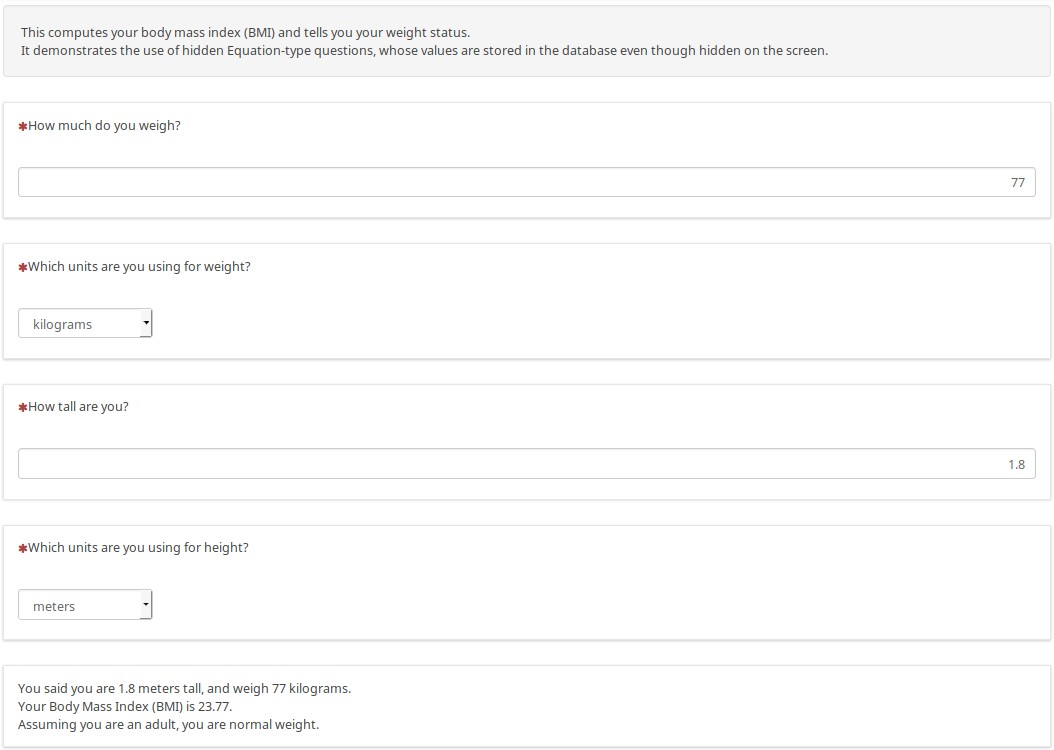
Once you enter your information (and you get to choose whether to use metric or non-metric units), you see a tailored report that summarizes what you entered, telling you your weight status:
Here is a different example, using non-metric units to show how the result changes dynamically:
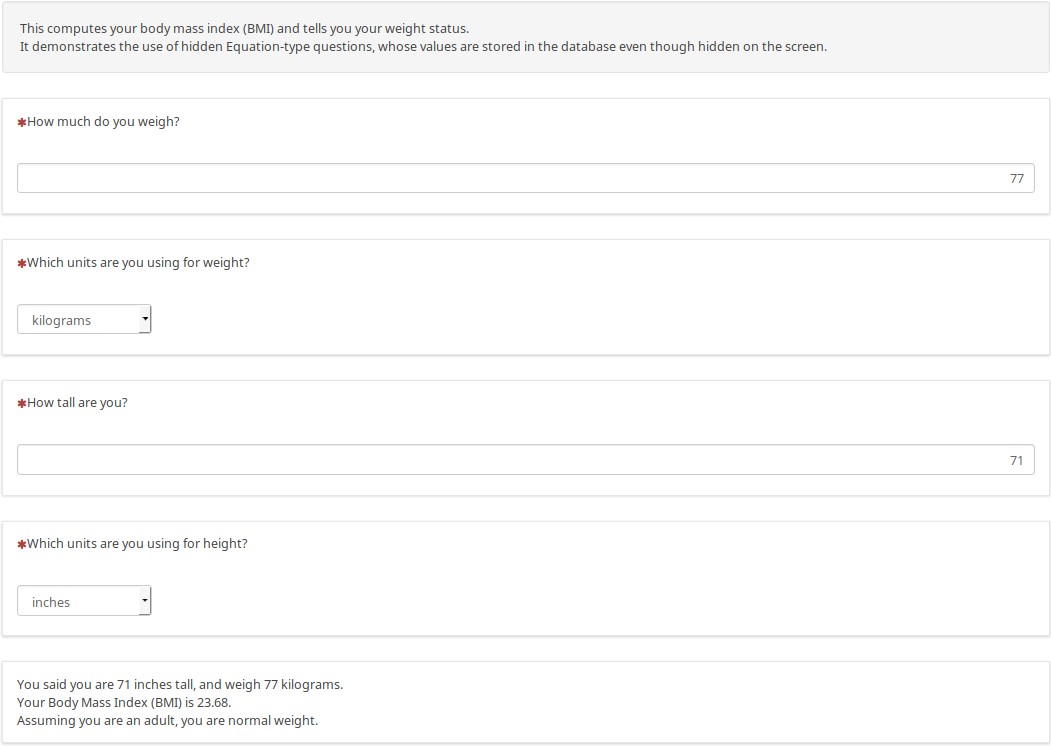
There are hidden Equation-type questions at the internal level that converts the data to metric (if needed), storing the metric height, weight, BMI, and weight status in the database without needing custom JavaScript.
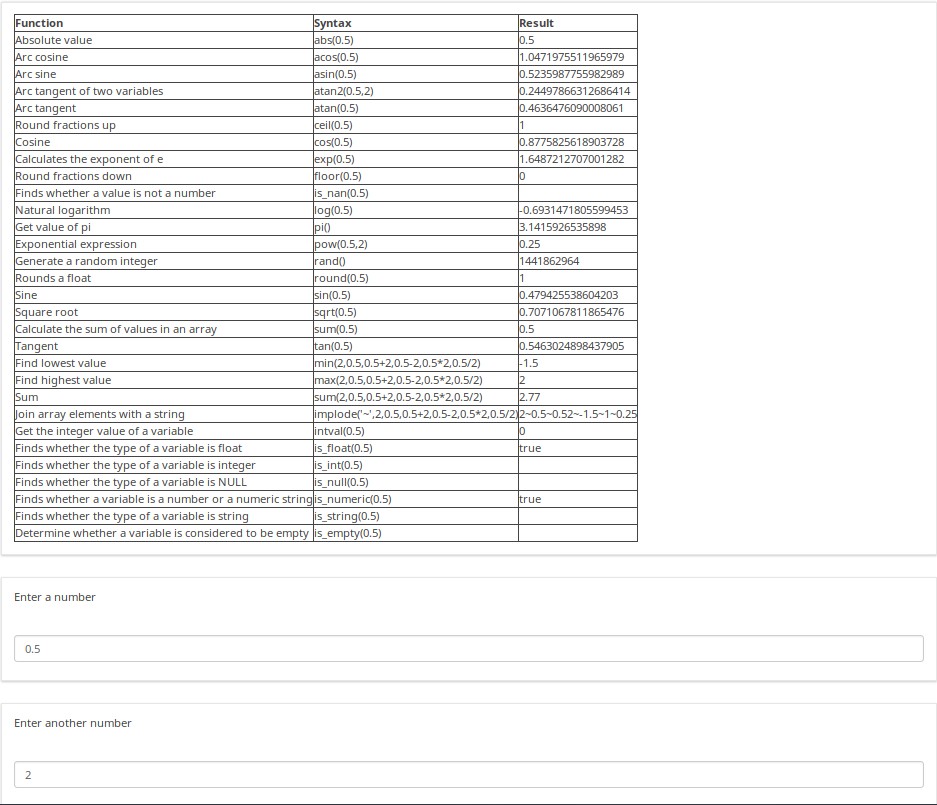
You can see in the next set of examples how you can use mathematical and other functions within tailored reports. This is how the page looks like before you enter any data. There is conditional logic to show blank cells if no (or non-numeric) data is entered, rather than showing "NaN" or "Divide by Zero".
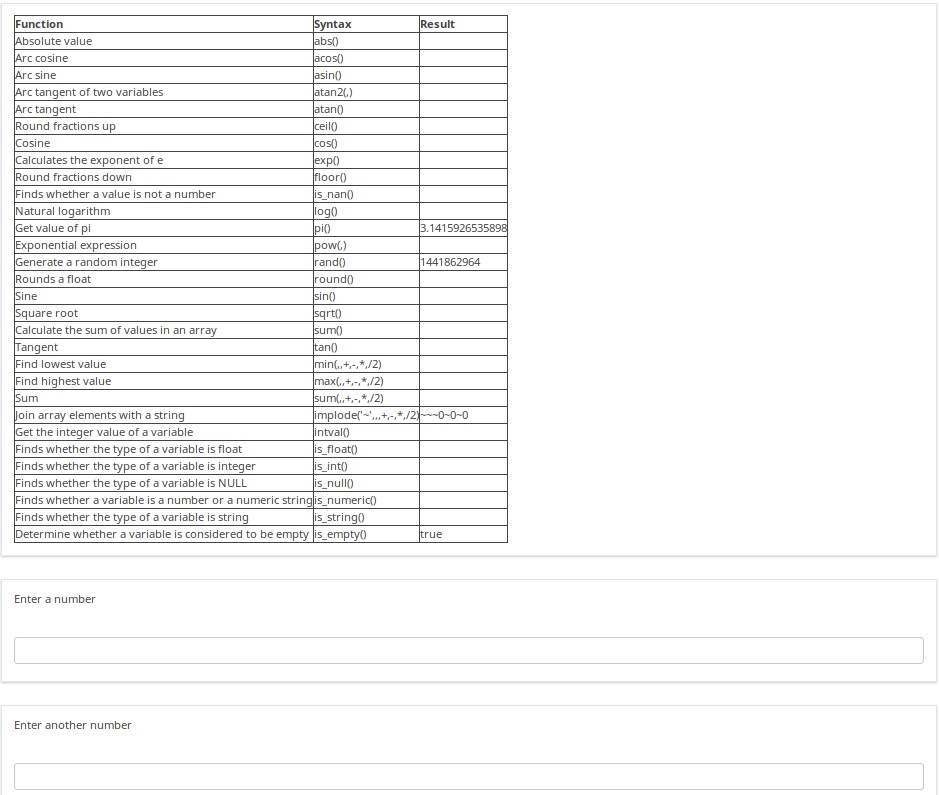
As numbers are entered, the on-page report changes to show the computation being performed, and its result.
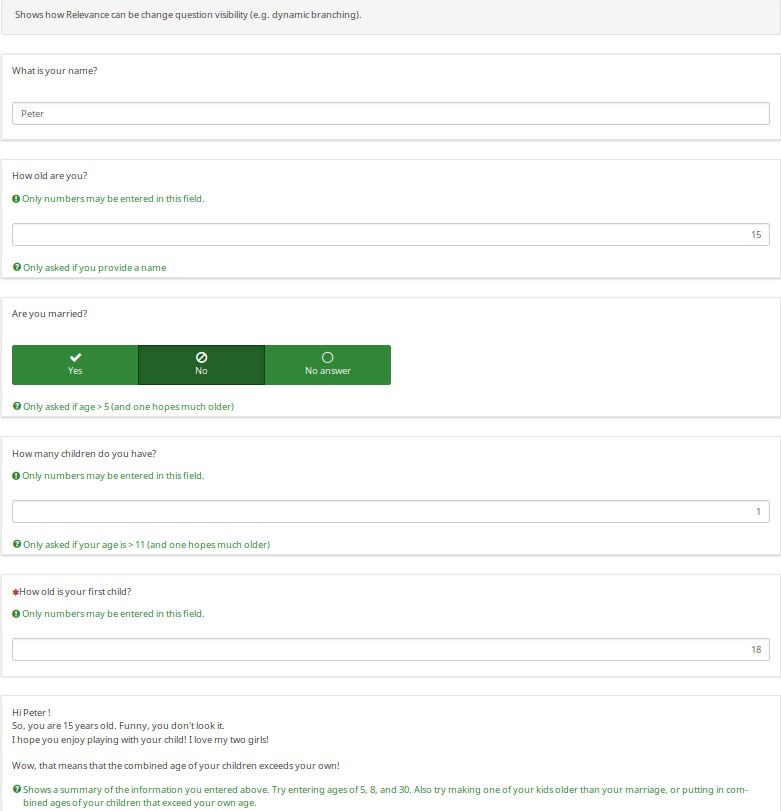
There are many other examples in this sample survey. For example, the below screenshot shows one of the dozens of ways you can fill out the Dynamic Relevance page. As the help text notes, try different ages, and especially illogical combinations of responses to see the amusing messages generated at the bottom. Also note that if you say that you have more than one child, the message will say "I hope you enjoy playing with your X children", rather than saying "I hope you enjoy playing with your child". This shows how you can easily micro-tailor sentences to make them match the gender and/or number of your subjects. You can even easily conjugate verbs and decline nouns based upon gender and number.
Download
To access the survey sample, please click on the following link: LS3_em_tailoring.zip.
Sample Census
Overview
This is a census example that asks how many people are in your household.
It demonstrates how group-level relevance can make it easier to implement a "loop" of questions. After creating the group for Person 1, I exported the group. Since I used qcode variable names like p1_name instead of the SGQA code, I could use a text editor to quickly edit and re-import the group several times (e.g., it took about 10 seconds to edit and re-import each repeating group, ensuring that all variables had unique variables names and that the group-level logic was correct).
You can also the copy question feature, but it won't be as fast as the option suggested above.
This also shows how you can prevent the Finished message from appearing until the survey is truly finished (e.g., when all needed groups are completed).
EM Features Demonstrated
- Group-level relevance - The follow-up groups (Person 1-5) only show for up to the number of cohabitants specified;
- Tailoring - The final report summarizes the demographic data for each cohabitant;
- Progressive question display - Whether in group or all-in-one mode, subsequent questions only show as soon as the preceding ones are answered.
Screenshots
The survey generates a tailored report showing the demographics of the specified number of cohabitants:

If you switch to question-at-a-time mode, you see that the index tailors the questions. Since the user said that the person is a woman, it asks "What is her name". And since we answered "Mary", the next question says "How old is Mary"?

Download
To download the survey sample, click here: LS3_group_relevance.zip.
Cascading Array Filters
Overview
This survey is based on the design of a survey courtesy of Joy Lane Research, LLC.
Screenshots
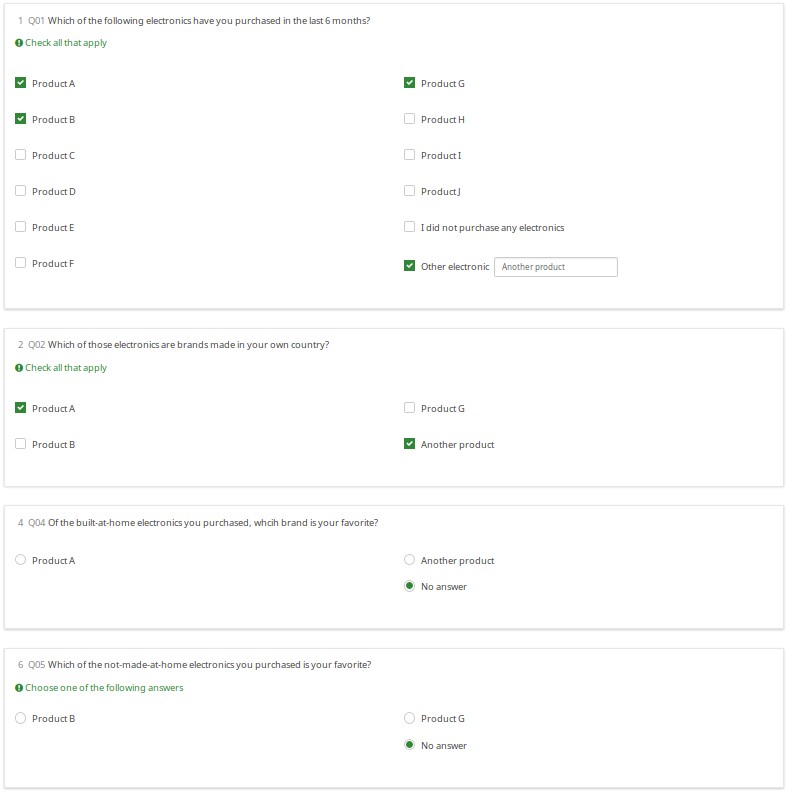
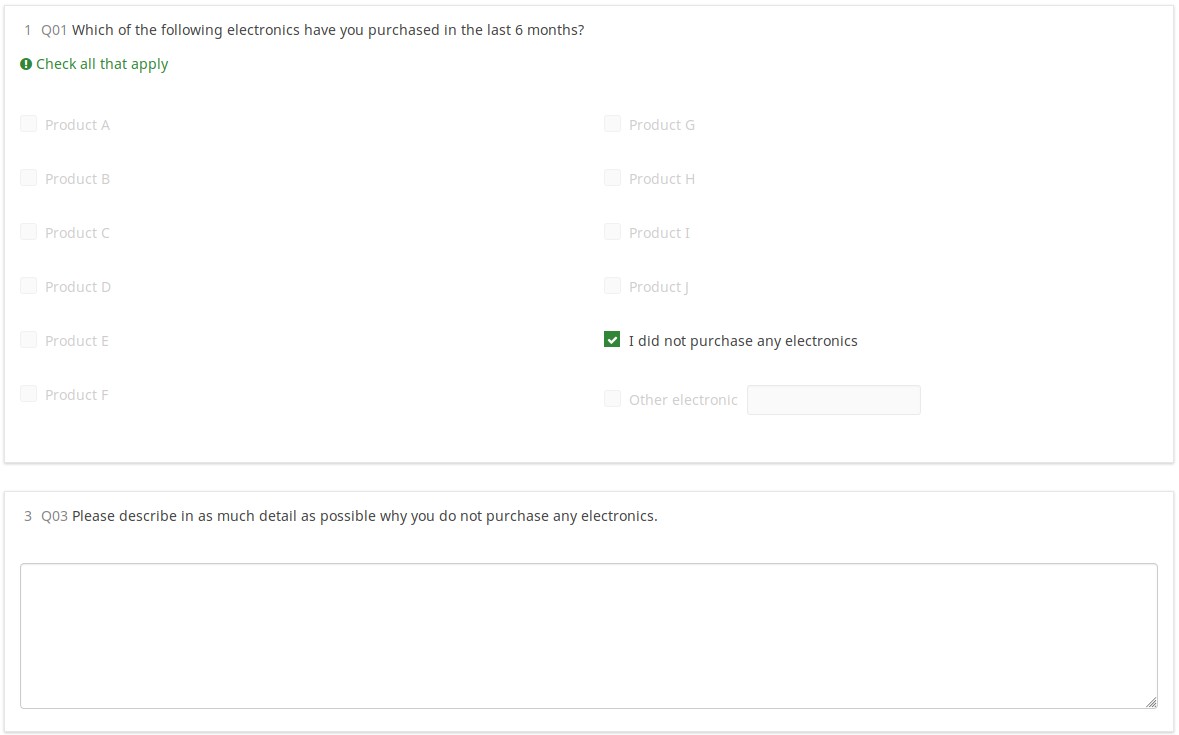
In the following, note that:
- Q02 only shows the set of products checked in Q01 (by using array_filter)
- Q02 also shows "Another product", the text entered into the "Other electronic" field in Q01
- Q04 only shows products from Q02 that were checked (so the array filter cascades)
- Q05 only shows products from Q02 that were not checked in Q02 (using a cascaded array_filter_exclude)
Download
Click on the following link to download the above example: LS2_cascading_array_filter survey example.
Piping/Tailoring Using All Question Types and Attributes
Overview
If you are confused about how to name your variables (SGQA vs Qcodes), you are not alone. Although the main documentation describes how to compose Qcode variable names, nothing beats seeing it in a working demo. This survey shows how you can access question attributes and responses using the ExpressionScript.
Content
- Examples of every question type
- All questions types that can use "other" are included so that you can see how that affects variable naming
- Default values for all the question types that accepts defaults
- Tailoring - On- and off-page reports showing all 16 available EM dot notation suffixes.
- These reports show all of the currently entered data (so show you how you could generate your own printable reports for users in lieu of the print-answers screen)
- Proper Qcode and SGQA naming of all variables
Screenshots
This is a huge survey, so we chose not to include screen shots. Instead, please download and play with it.
Download
Click on the following link to download the survey: LS3_EM_question_attributes.lss
Traditional validation, re-envisioned
Overview
This demonstrates all the validation types that make use of expressions and how they affect each of the question types that support validation. In many cases, the validation tips start hidden and only appear if a question fails validation criteria (thus also disappearing once the question passes the validation criteria).
Validation Types Demonstrated
- min_num_value_n - minimum value for an answer
- max_num_value_n - max value for an answer
- min_answers - minimum number of answers required
- max_answers maximum number of answers allowed
- multiflexible_min - minimum value allowed for an answer (for multiflexi numbers question type)
- multiflexible_max - maximum value allowed for an answer (for multiflexi numbers question type)
- min_num_value - minimum allowed sum across all answers for the question
- max_num_value - maximum allowed sum across all answers for the question
- equals_num_value - the sum across all answers for the question must equal this value
- validation - this is the regular expression validation for the question - it can apply to individual cells
Screenshots
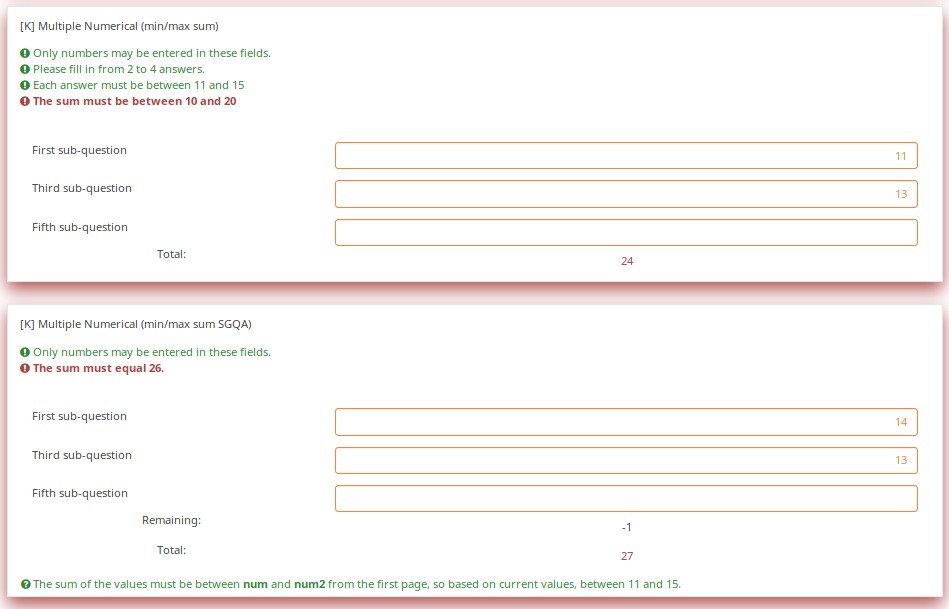
Using new CSS styles, each validation type shows up a separate tip. If they are shown, they can be hidden via the hide_tip option. The default option is to show them with red font if the question fails the validation criteria, and green if it passes them:
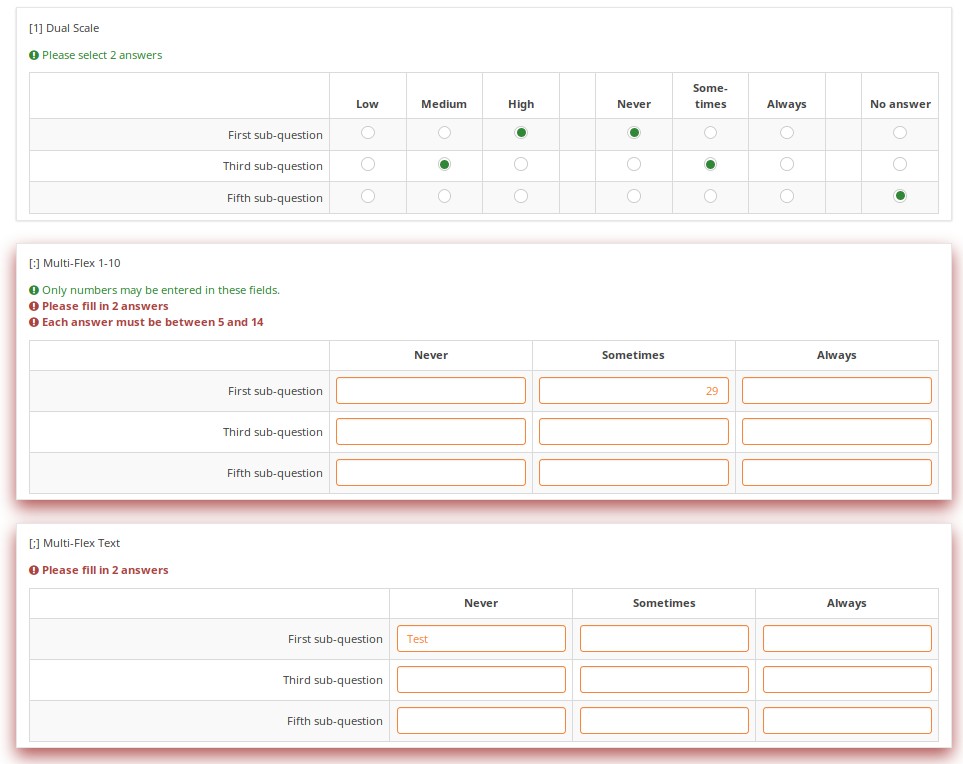
A user cannot submit a page with validation errors. They will be immediately warned if they entered wrong information:
Validation can be applied to individual cells within an array, such as in this example where regular expression validations ensure that each entry is a properly formatted US phone number including area code.

Download
To download the above example, click on the following link: LS3_Validation_tests.zip.
Validation Equations
Overview
Sometimes you need custom validation that cannot be achieved using the traditional min/max criteria. For this, you will need to use the em_validation_q and em_validation_sq options which let you construct complex validation equations at the question and subquestion level, respectively.
EM Features Demonstrated
- em_validation_q - this is an equation that determines whether the whole question is valid
- em_validation_q_tip - this is the message to show if the question fails em_validation_q criteria
- em_validation_sq - this is the equation that determines whether each subquestion (array cell) is valid
- em_validation_sq_tip - this is the message to show if any of the subquestions is invalid.
In general, when em_validation_sq is used, if any cell is invalid, the background color for that cell turns red to indicate that there is an error.
Screenshots
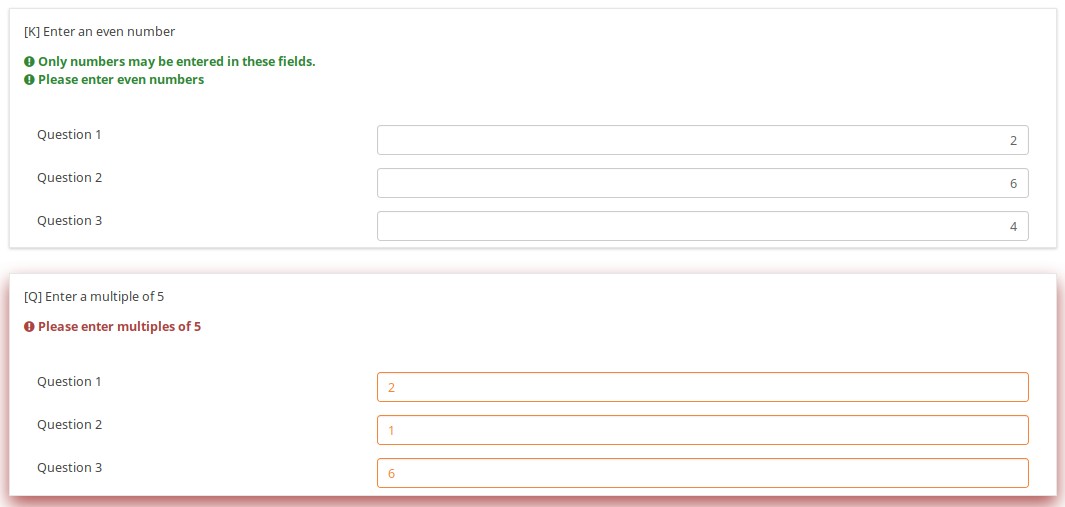
This question ensures that you enter the ages of your children in descending order by applying this validation equation:
q1_sq1 >= q1_sq2 && q1_sq2 >= q1_sq3 && q1_sq3 >= q1_sq4

In the below example, the validation ensures that no more than 3 questions are answered on any given row by applying this validation equation:
(sum(Test_A_1, Test_A_2, Test_A_3, Test_A_4, Test_A_5) <= 3) && (sum(Test_B_1, Test_B_2, Test_B_3, Test_B_4, Test_B_5) <= 3) && (sum(Test_C_1, Test_C_2, Test_C_3, Test_C_4, Test_C_5) <= 3)
You can also write this as follows, LimeSurvey automatically converting it at run-time to the above-listed expression.
(sum(self.sq_A) <= 3) && (sum(self.sq_B) <= 3) && (sum(self.sq_C) <= 3)

Download
To download the survey sample used in the above examples, click on the following link: ls2_test_em_sq_validation.lss.
Subquestion relevance
Overview
This shows how array_filter and validation criteria can interact. For validations that apply to sums, only relevant (visible) values are considered.
EM Features Demonstrated
It also shows dynamic reporting of the numbers of questions answered in the core questions.
Screenshots
Changing the number of visible rows dynamically changes the sum. Marking a subquestion as being irrelevant doesn't clear its value. Rather, if it is irrelevant, its values don't contribute to any equation.
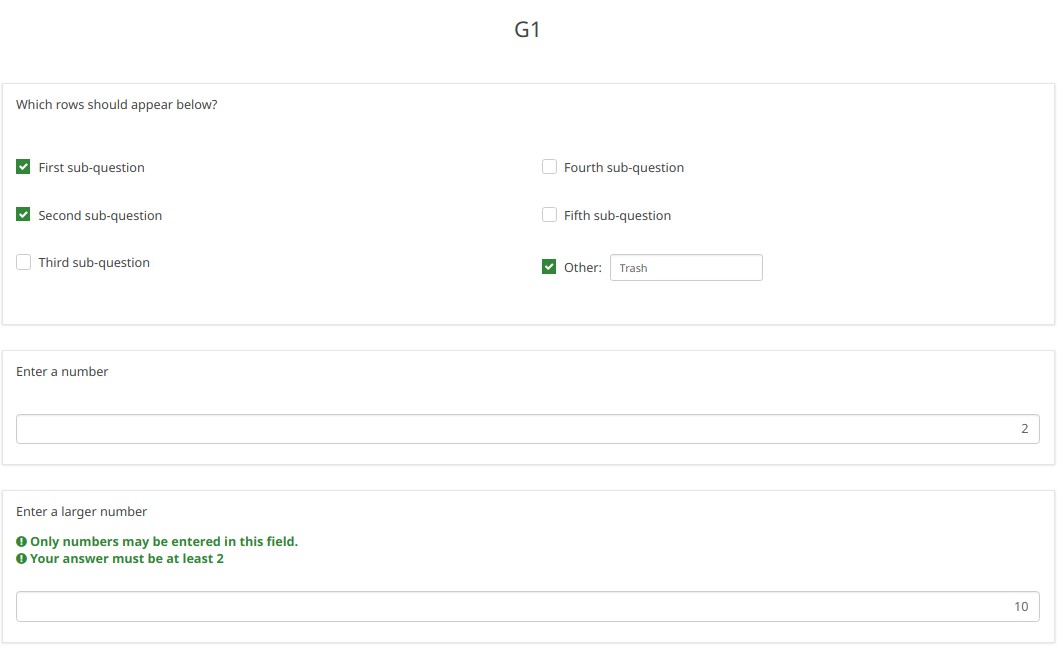
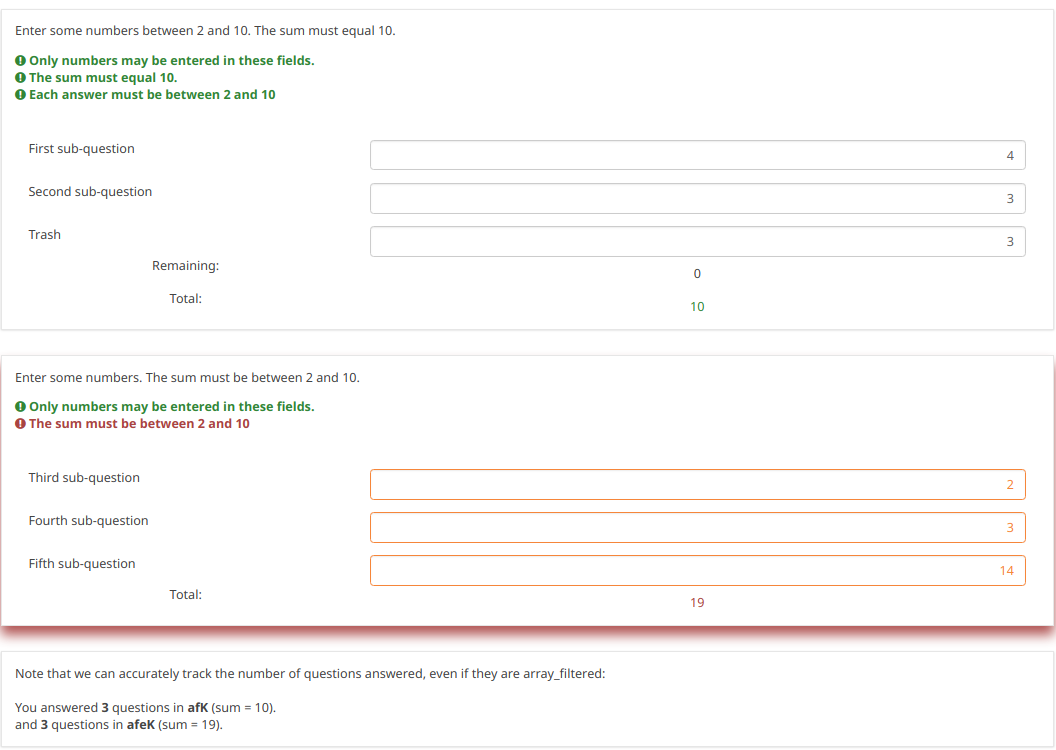
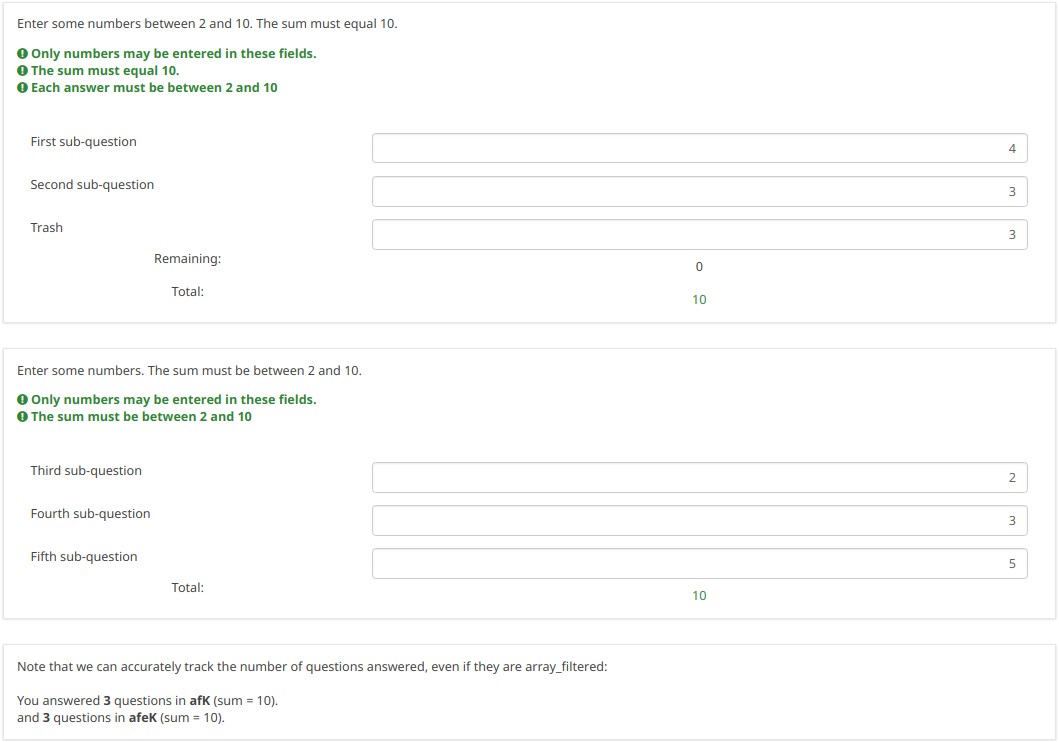
Note what happens when we check the "Fifth subquestion" for the first question "Which rows should appear below". Note that the sum for the second "Enter some numbers" question is now 5. Even though subquestion 5 for that question still has the value 14 (e.g., if you un-check the fifth subquestion, you will see the value of 14 again), that value does not contribute to the sum since it is currently irrelevant. All irrelevant data is cleared (NULLed in the database) on submit, but it stays available on the page in case users want or need to change their minds about answers.
Download
To download our example, click here: ls2_subquestion_relevance.lss.
Using Comma as Radix Separator (Decimal Point)
Overview
The ExpressionScript ensures that only valid numbers can be entered into numeric fields. If you enter an invalid number, you will be warned that something is wrong (e.g., in the case of the fruity theme, the whole question is "red-ed").
Note that the numeric values are always converted to using a period as the radix separator within the database. In this way, the statistical analyses will work appropriately.
To change the radix separator, access the Text elements options located under the Settings tab, and look for the decimal mark functionality.
Question Types Using Radix Separator
- Numerical input [N]
- Multiple numerical input [K]
- Array (Numbers) [:]
- Array (Texts) [;], when using the numbers_only attribute
- List (radio) [L], when using the other_numbers_only attribute
- Short free text [S], when using the numbers_only attribute
- Multiple short text [Q], when using the numbers_only attribute
- Multiple choice [M], when using the other_numbers_only attribute
- Multiple choice with comments [P], when using the other_numbers_only attribute
Screenshots
You may note in the below screenshots that comma can be used as a radix separator.

Download
To download the above example, click on the following link: ls2_comma_as_radix_separator.lss.
Randomization Groups
Overview
This survey demonstrates how to make use of the random_group attribute.
If this attribute is used, each time you start the survey, the question order is randomized. However, once the survey is started, the randomization order remains fixed, even if you change languages.
Screenshots
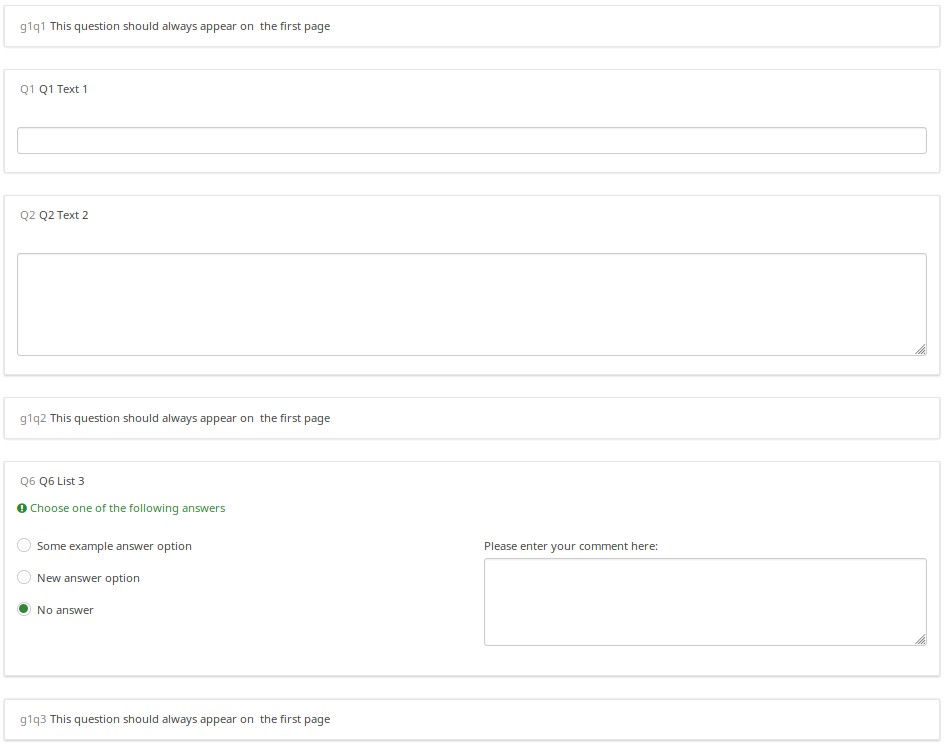
Let's check together the below example. The first random question on the page will either be Q1 , Q4, or Q7. The second randomized question on the page will either be Q2, Q5, or Q8.
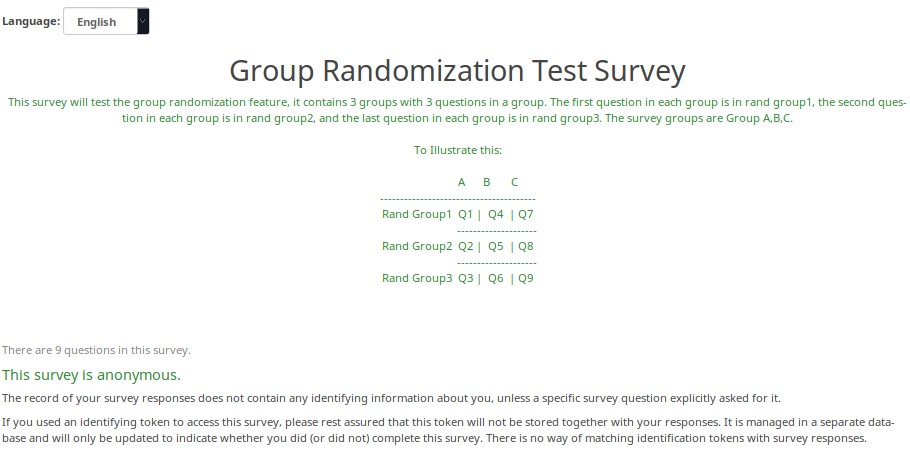
Here is the randomization generated the first time I tested this survey.
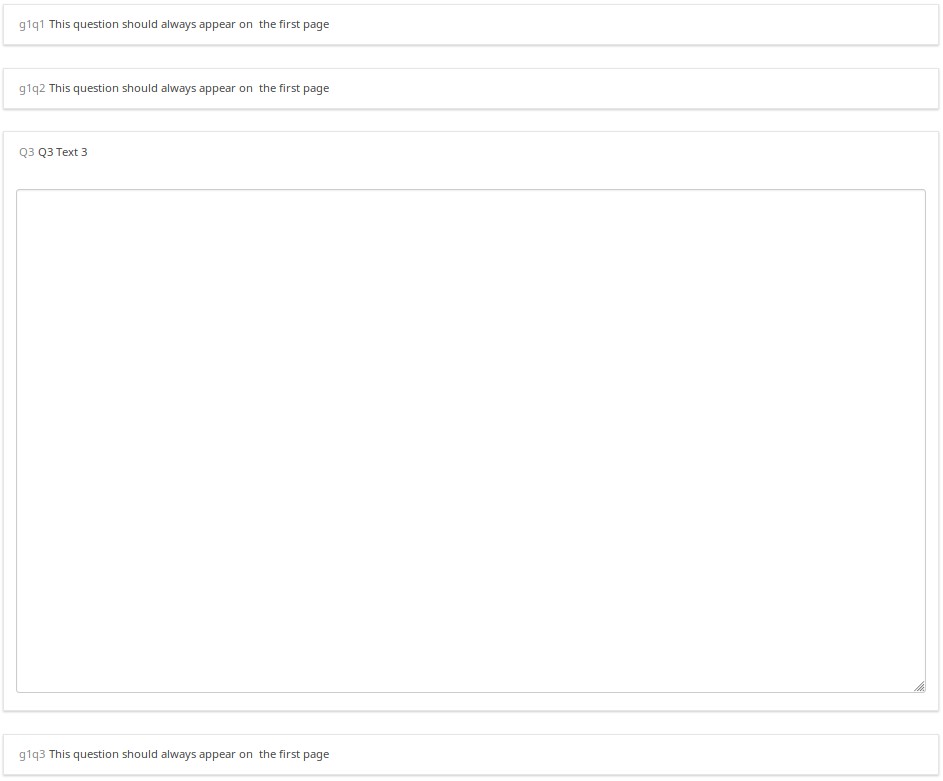
A different randomization was generated the second time I tested the survey.
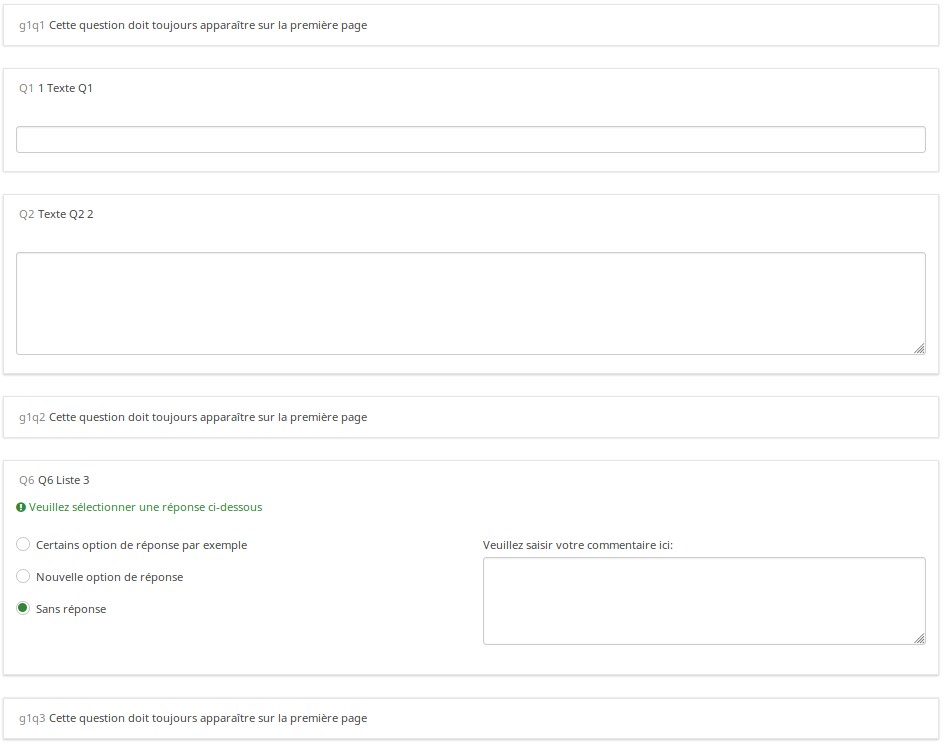
But, when I switched to French (without re-starting the survey), the randomization order remained intact.
Download
To download the above example, click on the following link: Randomization_Group_Test.lss
Randomly Ask One Question Per Group
Overview
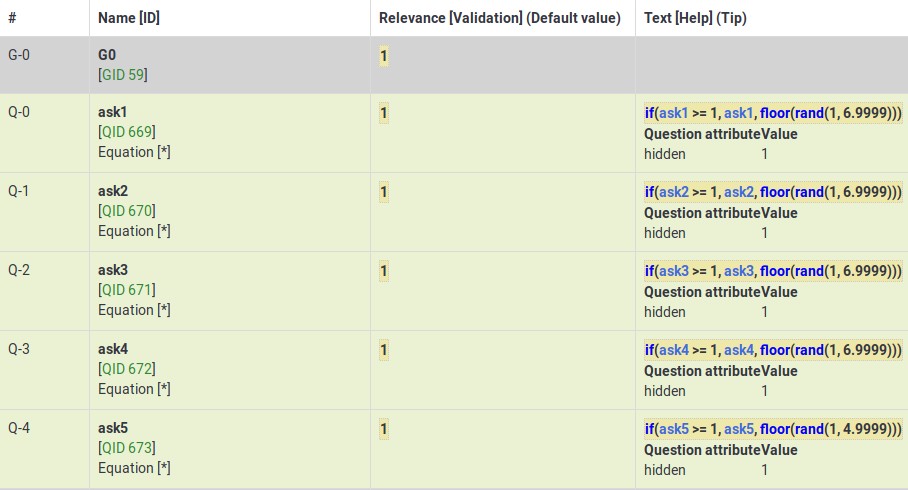
This survey shows how you can configure a survey to randomly display one question per group. In it, there are 5 groups of 6 questions each. At the outset, in Group 0, five hidden Equation questions, called ask1-ask5, are populated. Each one has the value of {floor(rand(1,6.9999))} in the question text field, which means that the variables ask1-ask5 will each have a value between 1 and 6. Then, each question in the group has a relevance equation like "ask1==N" where N is the Nth question in the group (so the third question in group 1 has the relevance equation "ask1==3").
This survey works equally well in survey-at-a-time, group-by-group, and question-by-question modes. Since the randomization is set in the first group, and that group is effectively hidden (since all of the ask1-ask5 questions are hidden), the randomization stays the same for the subject; but each different subject will have a distinct randomization.
Features Demonstrated
- Equation question type
- Randomization functions
- Conditional (if) function
Screenshots
This is Group0, which uses the Equation question type to select random values from 1 to 6 for each group (except the last group, which has only 4 questions). Note that the "if()" function first checks whether ask1 has already been set, and if so, uses that value. If the value hasn't been set, then it uses a random value to set the value of ask1.
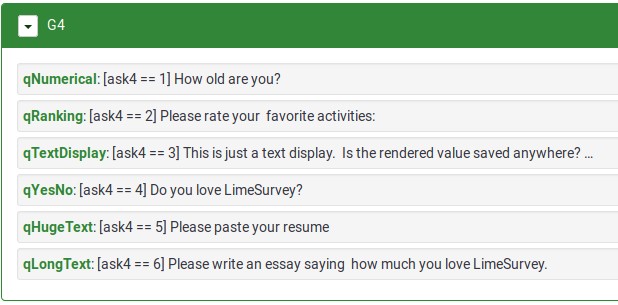
This Group shows how the variable (ask4) from Group0 is used to control which question is visible within the fourth group.
Download
To download the above survey example, click here: Random questions within a group survey example.
Randomly Ask A Specific Number Of Questions In A Group (a subset of the questions)
Overview
This survey shows how to ask a random subset of questions in a group. For example, show 5 random questions out of 10 questions located within a group.
The survey has one group containing 10 questions. All questions are assigned the same randomization group name. As a result, they will be displayed in a random order on page load. Each question is given a relevance equation that the sum of the "relevanceStatus" of all other questions in the group is less than the number of questions you want to show. Since relevanceStatus is assigned as questions are rendered, this effectively totals the number of preceding questions.
So, in our 5 out of 10 example, the equation for Q1 would be:
sum(Q2.relevanceStatus, Q3.relevanceStatus, Q4.relevanceStatus, Q5.relevanceStatus, Q6.relevanceStatus, Q7.relevanceStatus, Q8.relevanceStatus, Q9.relevanceStatus, Q10.relevanceStatus) LT 5
For Q2, it would be:
sum(Q1.relevanceStatus, Q3.relevanceStatus, Q4.relevanceStatus, Q5.relevanceStatus, Q6.relevanceStatus, Q7.relevanceStatus, Q8.relevanceStatus, Q9.relevanceStatus, Q10.relevanceStatus) LT 5
And so on...
Features Demonstrated
Download
To download the above example, click on the following link: Random 5 out of 10 survey example.
Rating User-Entered List of Products
Overview
The below example shows how you can ask users to list a set of products that interest them, and then have them rate those products.
EM Features Demonstrated
- Tailoring answers - when rating products, the labels come from the comment field of the preceding multiple choice question
- Tailoring scales - many advanced questions options, like scale headings, can also be tailored.
Screenshots
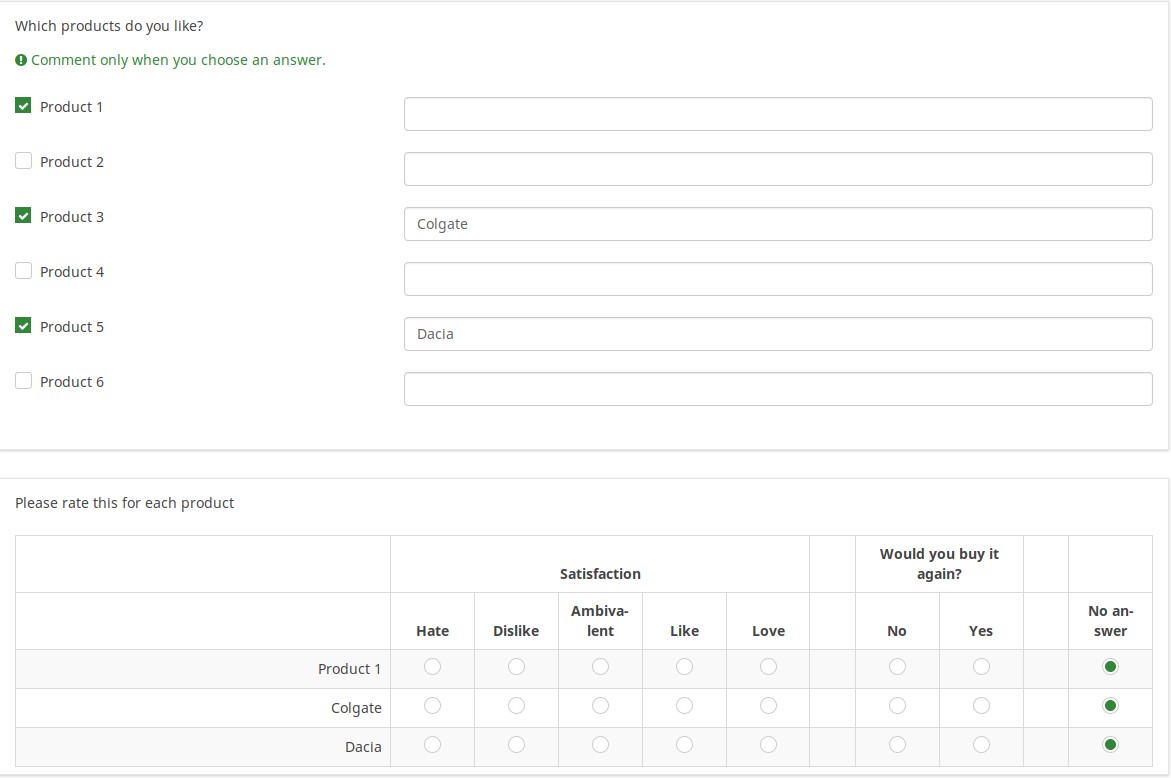
This image shows that even though only products 1,3, and 5 were selected, only those 3 are displayed (using the array_filter attribute). Moreover, the row labels in the second question are either the product numbers (if nothing is entered into the comment field) or the contents of the comment fields.
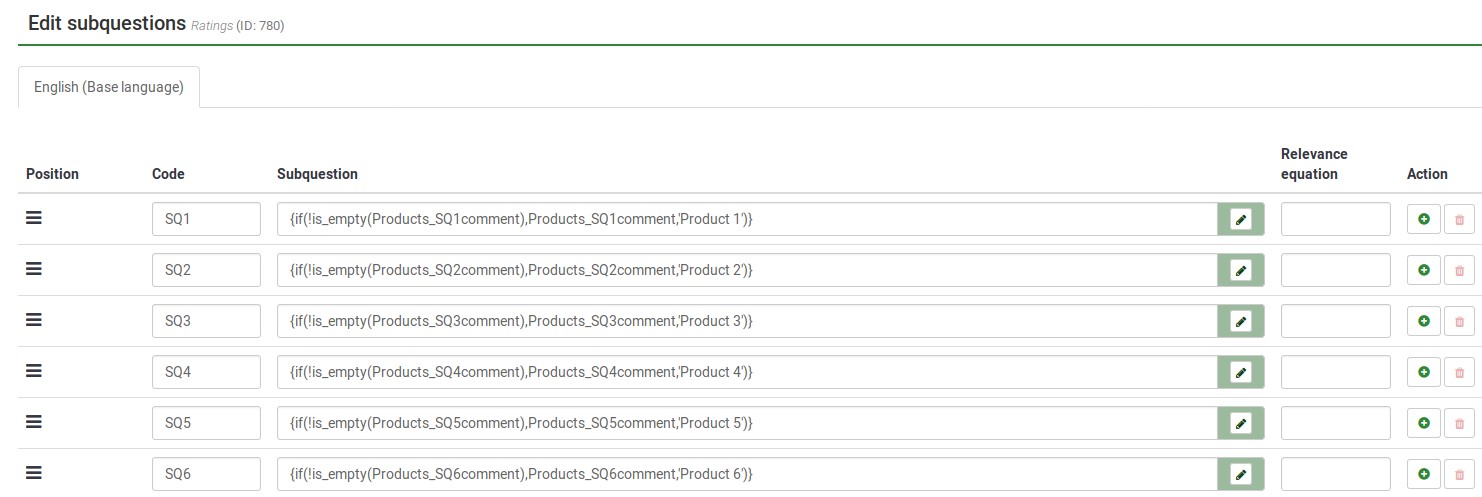
This image shows how the tailored answers are specified:
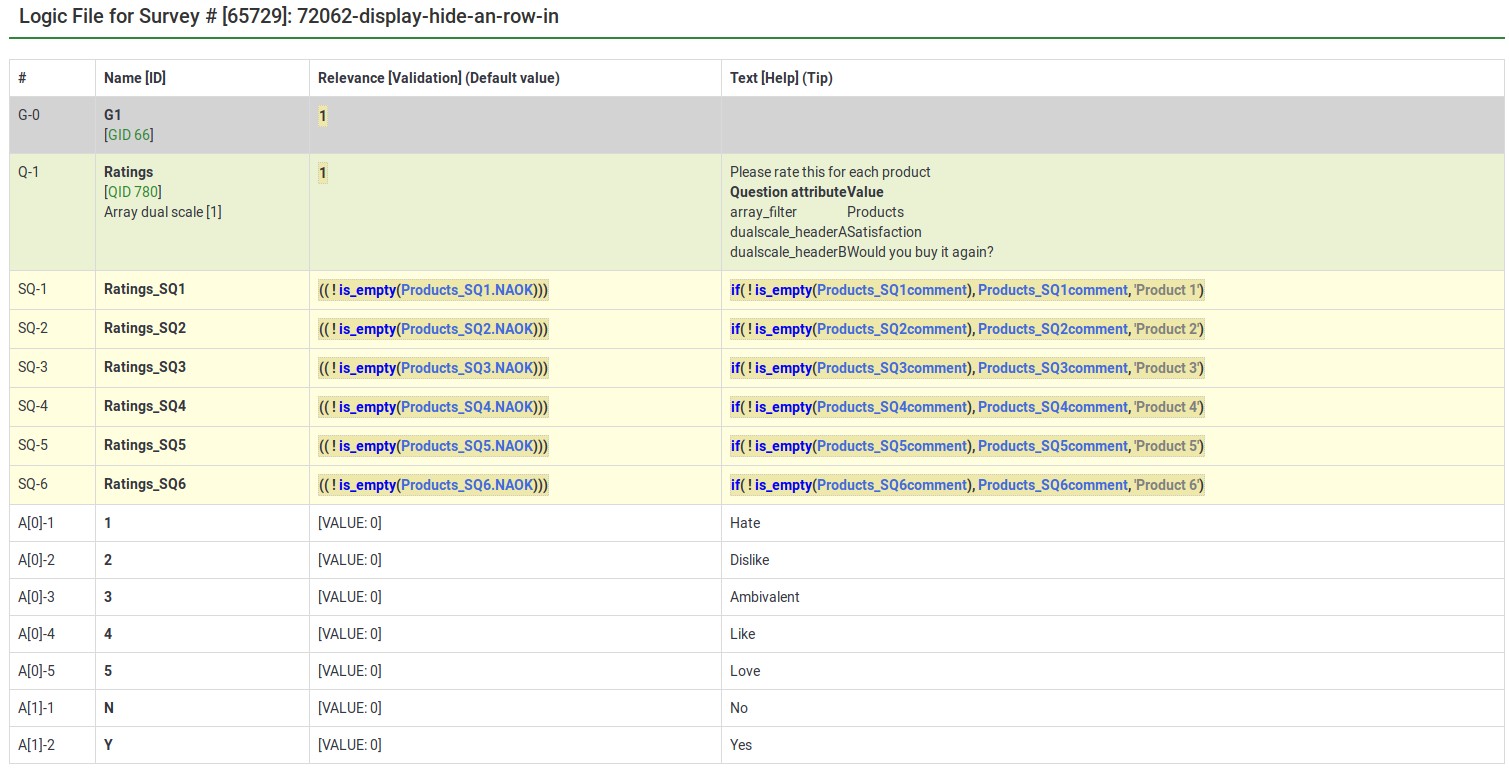
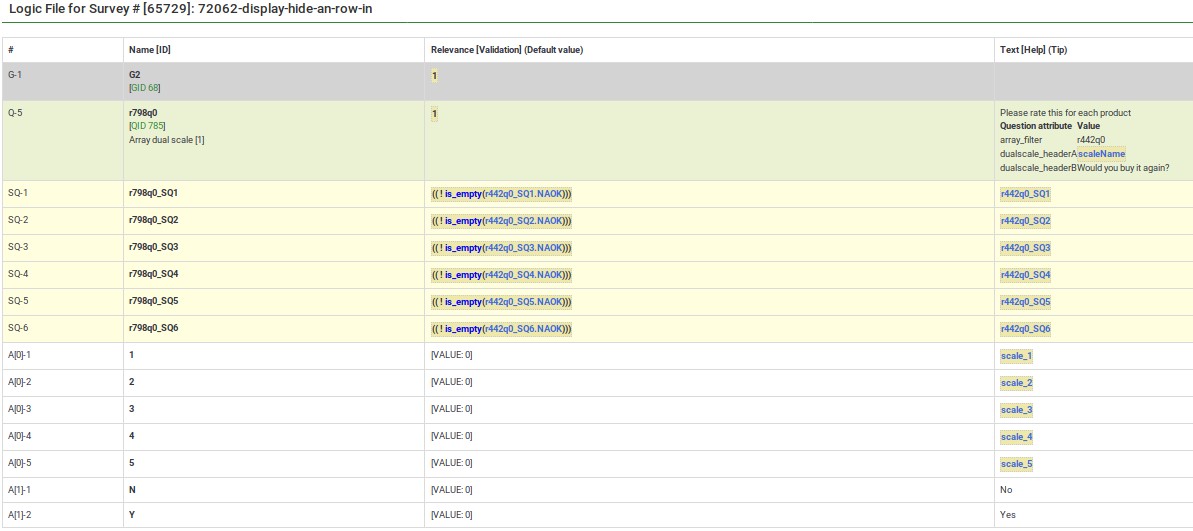
Here is the Show Logic File for that question, which lets us verify that the conditional logic works as desired (e.g., to see whether there are any syntax errors):
The next image shows a group in which you specify a 5 point rating scale (Options 1-5), the title of the scale, and the products you want to rate. The final question shows that each of the parts of the array question can be tailored:
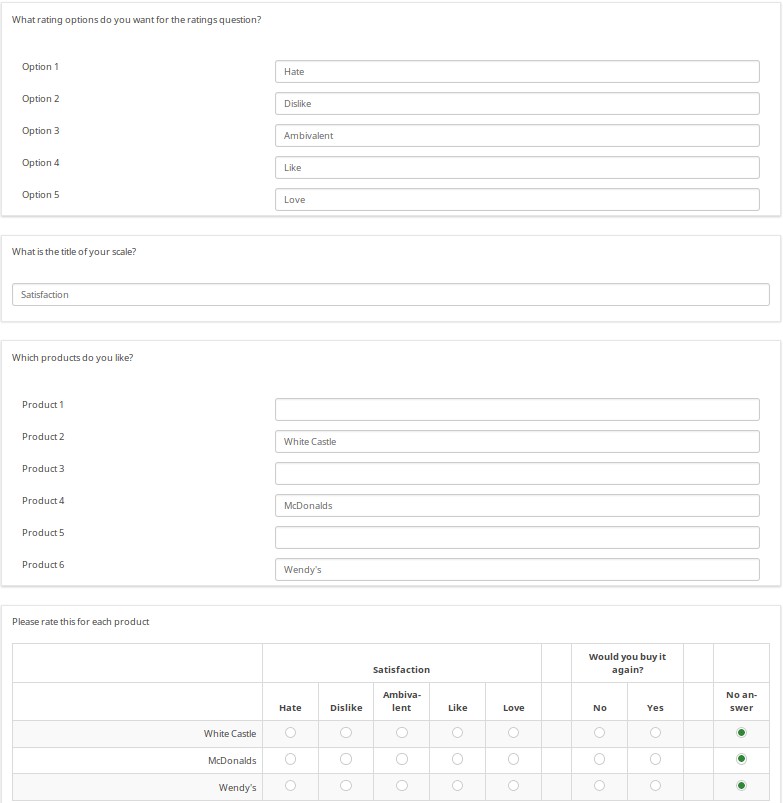
The next image shows the logic file view of the last question. As you can observe, the subquestions, answers, and scale headers can be tailored.
Download
To download the survey example from above, click on the following link: Rating user-entered list of products survey example.